
Download Full
Document Here
Conceptual Site Model, March 2018
Hartford Petroleum Release Site
6. VAPOR PHASE
This section describes the vapor phase component of the CSM. The first subsection (Section 6.1) describes the general understanding and working hypotheses regarding the vapor intrusion pathway beneath the Hartford Site with the remaining subsections providing the empirical data used to test these hypotheses and refine the understanding of the vapor intrusion pathway and includes the following:
- Section 6.2 - Provides a detailed description of the SVE system operations since 1992. It should be noted that all the data collected, including the historical and recent data described within this CSM, has been collected during operation of the SVE system.
- Section 6.3 - Examines the distribution of volatile petroleum hydrocarbons within the various hydrostratigraphic units and changes to the source over time using historical analytical results and routine screening data collected as part of the SVE system effectiveness monitoring program.
- Section 6.4 – Describes the in-home monitoring program and results, with a focus on data collected over the past five years (2013 through 2017), including a summary of those structures where the vapor intrusion pathway was complete, as well as an evaluation of the conditions that led to a completed pathway. This section also describes the measures taken to mitigate the vapor intrusion pathway when complete.
This vapor phase component of the CSM is integral in defining future remedial management areas, described in Section 8.0, and assessing potentially viable corrective measures. The data included in the section will be used to identify portions of the Hartford Site where vapor phase concentrations have remained elevated despite 25 years of operation of the SVE system and where a completed vapor intrusion pathway remains a risk to residential receptors in overlying structures. This information will be useful in prioritizing corrective action implementation within the various remediation management areas and determining which remedial alternates may be safe, as well as potentially effective prior to future bench scale or pilot testing.
6.1. VAPOR INTRUSION PATHWAY
A complete vapor intrusion pathway requires: (1) a source of volatile constituents, in the case of the Hartford Site the source includes historical LNAPL released from the refineries, terminals, and pipelines adjacent to and beneath the northern portions of the Village of Hartford, (2) partitioning of the volatile hydrocarbon constituents from the source into the vapor phase, and (3) migration of the vapors into structures where occupants are present. Additionally, the concentration of volatile constituents within the structure must pose an unacceptable risk to human health (whether acute or chronic) and must be attributed to the source beneath the ground and not to alternate sources within the structure or outdoor air. If the pathway is determined to be complete, risk management activities are necessary and may include (i) reducing the concentration of volatile petroleum hydrocarbons beneath the structures to prevent migration into indoor air through the use of mitigation measures such as sub-slab depressurization or low flow air injection (described in Section 6.4), or (ii) reducing the indoor air concentrations through the use of mitigation measures such as ventilation.
At sites underlain by petroleum hydrocarbons, such as the Hartford Site, migration of volatile petroleum related constituents can be retarded by biological degradation where soil microbes metabolize hydrocarbon vapors as a source of energy. The hydrocarbon vapors are generally reduced through aerobic biodegradation, where oxygen in the atmosphere migrates down into the subsurface by diffusion and advection due to barometric pressure changes. As biodegradation occurs the concentration of oxygen is reduced along with the concentration of volatile constituents (ITRC 2014, USEPA 2015). Within some portions of the Hartford Site, the rate of oxygen supplied into the subsurface may be limited due to the presence of finer-grained clay units present at shallow depths. However, operation of the SVE system may enhance the availability of oxygen within deeper portions of the vadose zone near the operating extraction wells. In addition, hydrocarbon vapors may also migrate upward towards the ground surface at a rate that is faster than they can be degraded by microbes. A conceptual model of the vapor intrusion pathway beneath the Hartford Site is provided as Figure 6-1.
One of the key components in determining if volatile constituents from the subsurface are potentially affecting human health, is an understanding of the migration route from beneath the structure into indoor air. Detections of petroleum related constituents in indoor air would only be indicative of a complete pathway for vapor intrusion if volatile petroleum hydrocarbon constituent concentrations are greater than those expected due to alternate sources within the structure or outdoor air. Volatile constituents are ubiquitous in indoor and outdoor air from a variety of other sources including but not limited to natural gas operated heaters and appliances, automobiles, gasoline powered tools, a variety of different consumer products, insecticides, pesticides, glues, cleaners, degreasers, lubricants, oils, and building materials. Furthermore, many volatile petroleum and non-petroleum related constituents are also present in structures where cigarettes or similar tobacco products are used.
Upward migration of vapors via diffusion and advection from potential sources in soil and groundwater beneath overlying structures are offset by dilution with ambient air in the structure. The vapor intrusion pathway cannot be considered complete unless volatile constituent concentrations are higher beneath the building compared to indoor air. This decrease in the concentration of volatile constituents from soil vapor into indoor air is generally termed attenuation. The soil vapor to indoor air attenuation factor provides the best single line of evidence to indicate whether vapor intrusion may be the cause of volatile constituents detected in indoor air.
The relationship between rising river stage, increasing groundwater elevations, advective migration of hydrocarbon vapors, and a completed vapor intrusion pathway in structures at the Hartford Site has been postulated since the early 1970s. Evidence of odor complaints and elevated concentrations of petroleum hydrocarbons beneath structures attributed to rainfall events and rising river stage and groundwater elevations was referenced in a number of reports prepared by the various refineries and their consultants between the 1970s and 1990s (USEPA et al. 2010). It was identified that more than 70% of the reported vapor intrusion related complaints occurred when the Mississippi River stage increased at a rate of two feet or more per day, when the river elevation was already above 410 ft- amsl (ENSR-AECOM 2008).
6.1.1. SUMMARY OF HISTORIC ODORS AND FIRES
The first reported instance of volatile petroleum hydrocarbons migrating into overlying buildings from LNAPL beneath the Hartford Site appears to have occurred in May 1966, in the form of an odor complaint (alleged smell of petroleum hydrocarbons) from a resident to the Hartford Police and Fire Departments. Since this first instance, there have been more than 360 odor complaints and 26 fires reported in structures (USEPA et al. 2010). The following is a summary of the frequency of odor complaints that have been associated with intrusion of volatile petroleum related constituents into structures by decade:
- 1960s - 7 odor complaints
- 1970s - 245 odor complaints
- 1980s - 20 odor complaints
- 1990s - 77 odor complaints
- 2000s - 14 odor complaints
- 2010s - 0 odor complaint
Reports of “fires” in structures typically consisted of a small flame present immediately along the basement walls. While complete structural losses have not been documented, content losses and/or property damage has been associated with a complete vapor intrusion pathway within a few structures. Figure 6-2 provides a summary of structures where historical fires or odor complaints were reported at the Hartford Site.
6.2. VAPOR EXTRACTION SYSTEM
In response to odor and fire complaints, a SVE system was installed and began operating in the northern portions of the Village of Hartford in August 1992, with the primary purpose of preventing migration of volatile petroleum hydrocarbons from the subsurface into overlying structures. The extraction system also had the additional recognized benefit of reducing the mass of petroleum hydrocarbons present in the shallow strata. As described in Section 3.2, this initial system consisted of 12 vapor control boreholes, two 75-HP blowers with a combined capacity of approximately 1,500 scfm, and a single thermal treatment oxidizer capable of treating up to 27 million BTUs per hour (Clayton 2003a). As shown on Figure 3-1, more than 820,000 gallons of volatile petroleum related hydrocarbons were recovered via operation of the original SVE system.
6.2.1. SVE SYSTEM REPLACEMENT
Over time, a steady decline was noted in the vapor flow rates corresponding to a significant increase in system vacuum. By August 2003, the vacuum had reached the treatment system limits, and significant amounts of dilution air were needed to keep the thermal treatment system from shutting down (Clayton 2003a). Significant biofouling of the vapor control borings and thermal treatment system components (including the flame arrestor) were observed during a detailed inspection conducted in October 2003 (Clayton 2003b).
In January 2004, the first replacement SVE well, HSVE-001D, was installed in proximity to vapor control boring VCB-1, to pilot test the efficacy of continued vapor extraction within the Village of Hartford. The pilot test results indicated that the flow rate and mass recovery improved by more than 10 times via replacing the existing vapor control boring with a new extraction well (Clayton 2004a).
Based on the results of this vapor extraction pilot test, expansion of the SVE system was proposed to be completed in three phases including: (1) Phase I involved replacement of the existing vapor control borings and installation of new extraction wells along the eastern portion of the Hartford Site, south of East Forest Street, (2) Phase II included installation of new wells within the western portion of the Hartford Site including the area around the community center, and (3) Phase III included the installation of new extraction wells on the east side of the Hartford Site, north of East Forest Street. Concurrent to the installation of the new vapor extraction wells, the thermal treatment system was replaced to accommodate the expected increases in vapor flow and mass recovery (Clayton 2004c). Figure 3-2 shows the general location of the SVE extraction wells and transmission piping, as well as the SVE Effectiveness Zones (Zones 1 through 6) established for the purpose of evaluating the system performance.
6.2.1.1. PHASE I AND II
Extraction wells HSVE-001S through HSVE-030D were installed between 2004 and 2006 by the Hartford Working Group as part of the Phase I and Phase II modifications to the SVE system and consist of a 4-inch diameter well connected to 4-inch diameter conveyance line. The individual well, valves, flow meters, and sample/vacuum ports are located in a single 4-foot by 4-foot steel vault. Flow rate within the Phase I and Phase II extraction wells were generally measured using a Dwyer Series 160 Straight Pitot Tube. Typical wellhead configuration for the extraction wells installed during Phase I and II are shown on Figure 6-3.
The Phase I and II extraction wells were generally installed within the shallow strata as nested pairs with an "S" indicating the shallow well and "D" identifying the deeper vapor recovery well. The shallow wells are usually screened within the North Olive stratum. The deep wells are typically screened within the Rand, Main Silt, and Main Sand strata but can have longer screen intervals that also extend into the shallower strata and clay lenses. In cases where nested wells were installed, the deep intervals generally overlap with the shallow intervals.
6.2.1.2. PHASE III
Extraction wells HSVE-031 through HSVE-103 were installed during the Phase III expansion between 2006 and 2008. The Phase III extraction wells were constructed with a small radius vault for the wellhead and a separate 4-foot by 4-foot steel control vault to house the valves, flow meter, and sample ports. The extraction well was constructed with a 4-inch by 4-inch by 2-inch tee allowing connection of a 2-inch line that extends from the wellhead to the control vault. Flow rates in the Phase III extraction wells are measured using a Preso Coin-3 Venturi flowmeter, installed within the 2-inch line. The 2-inch line increases to 4-inches as it exits the control vault and connects to the SVE conveyance lines. Typical wellhead configuration for the extraction wells installed during the Phase III expansion are shown on Figure 6-3.
6.2.1.3. EFFECTIVENESS ZONE 1 EXPANSION
An evaluation of the effectiveness of the vapor extraction wells located on West Birch and West Arbor Streets was conducted in 2014 in response to a completed vapor intrusion pathway within three structures on West Birch Street in 2013 (described in Section 6.4.5). Routine monitoring performed in the effectiveness monitoring wells and extraction wells indicated that the SVE system was not preventing migration of petroleum hydrocarbons within the shallow portions of the subsurface in this portion of Effectiveness Zone 1 during rapid increases in the Mississippi River stage (Trihydro 2015a). Expansion of the SVE system in Effectiveness Zone 1 was performed to mitigate the vapor intrusion pathway during periods of rapid rise in the Mississippi river stage and also to enhance mass recovery of volatile petroleum hydrocarbons from the smear zone beneath West Birch and West Arbor Streets.
Between December 2014 and February 2015, six additional extraction wells (HSVE-105S, HSVE-105D, HSVE 106S, HSVE-106D, HSVE-107S, and HSVE-107D) were installed on West Birch and Arbor Streets. In addition, three existing SVE wells (HSVE-025S, HSVE-026S, and HSVE-027S) were plugged and abandoned, as these wells were shown to be short circuiting with the deeper paired wells. The new wells were installed as nested pairs with the shallow extraction well screened within the North Olive stratum and the deep well screened across the smear zone within the Main Sand stratum.
The extraction wells were constructed in a similar manner to the Phase III wells with: (1) the extraction well completed within a separate small diameter vault, (2) constructed with a 4-inch by 4- inch by 2-inch tee at the top of the well that allows a 2-inch line to extend beneath the ground, from the extraction well to a separate control vault, and (3) the 2-inch line increases to 4-inches as it exits the control vault and connects to the SVE conveyance lines. However, rather than installing a
separate control vault for each extraction well, a single control vault containing a Preso Model V-65 In-Line Venturi flowmeter and rotary control valve was installed to monitor and adjust vapor extraction rates for each shallow and deep nested pair. The configuration within the control vaults allows for vapor recovery from both wells simultaneously; although the shallow or deep well can also be operated individually via shut-off valves.
6.2.1.4. EFFECTIVENESS ZONE 6 EXPANSION
On November 17, 2015, Apex met with the USEPA and Illinois EPA to discuss the progress of remedial alternatives evaluation and implementation at the Hartford Site, including those activities described within the Active LNAPL Recovery System 90% Design Report (90% Design Report, Clayton et al. 2006). In an effort to continue to optimize and implement the vapor extraction components, as described within the 90% Design Report (Clayton, et al. 2006), Apex conducted additional testing and evaluation of the infrastructure and operations within Effectiveness Zone 6. The results of these efforts were summarized within the final Soil Vapor Extraction System Effectiveness Zone 6 Optimization Report (212 Environmental 2016c) and included the following recommendations:
- Connection of existing SVE wells HSVE-001D and HSVE-030S to the Phase III transmission lines; while concurrently abandoning extraction well HSVE-001S.
- Installation and connection of two new SVE wells, one located to the north of extraction well HSVE-099 (well HSVE-108) and the second situated to the west of SVE wells HSVE-075 and HSVE-076 (well HSVE-109).
The USEPA and Illinois EPA also requested that Apex install up to five additional SVE wells along North Olive Avenue in Effectiveness Zone 6. It was agreed that two additional SVE wells (wells HSVE- 110 and HSVE-111) would be installed adjacent to North Olive Avenue near existing SVE wells HSVE- 056 and HSVE-059, respectively.
Two additional wells were also proposed by Apex within the revised Semiannual Soil Vapor Extraction System Operations, Maintenance, and Monitoring Report, October 2015 through March 2016 (212 Environmental 2017a) to enhance and optimize vapor recovery where total volatile petroleum hydrocarbons (TVPH) concentrations were persistently elevated within the North Olive stratum. Specifically, Apex recommended installing an additional well (HSVE-112) in Effectiveness Zone 5 and connection of previously installed well HSVE-104 located in Effectiveness Zone 1.
The USEPA and Illinois EPA subsequently requested that Apex install an additional extraction well (HSVE-113), to the east of well HSVE-104 within the alley between West Birch and West Cherry Streets. Existing extraction wells HSVE-003S and HSVE-003D, located on West Cherry Street, had become repeatedly occluded with groundwater and were not effectively recovering volatile petroleum hydrocarbons from the shallow portions of the subsurface. Elevated TVPH concentrations were measured in nearby multipurpose monitoring point MP-033B screened at a similar elevation to basements along West Cherry Street. In addition, there were elevated TVPH concentrations measured beneath and within several structures on West Cherry Street (described in Section 6.4.5).
Extraction wells HSVE-108 through HSVE-113 were installed in May 2017 and connected to the SVE system in June 2017 along with existing SVE wells HSVE-001D, HSVE-030S, and HSVE-104. Details regarding the installation and connection of these wells was provided in the correspondence entitled Summary of Soil Vapor Extraction System Expansion (212 Environmental 2017d). As shown on Figure 6-4, the new extraction wells were constructed, similar to the Phase III wells, with a smaller radius vault for the wellhead and a separate control vault to house the valves, stinger conduit, and sample ports. An existing control vault was utilized in place of a new vault for wells HSVE-109 (used the control vault for well HSVE-075), HSVE-110 (used the control vault for well HSVE-056), and HSVE-111 (used the control vault for well HSVE-059). The repurposed control vaults were selected based on the inoperability of the existing SVE wells due to continued occlusion of the well screen with groundwater since installation. Wells HSVE-056, HSVE-059 and HSVE-075 remain in place along with the associated piping but are not currently operable and are no longer considered part of the SVE system.
A 1-inch piezometer was installed adjacent to the newly installed SVE wells to allow for measurement of fluid levels without disruption of the vacuum applied to the SVE well. The installation of the separate piezometer provides a more accurate fluid level measurement from the new extraction wells, as depicted on Figure 6-4.
Finally, the new wells were designed to allow for the use of an ex-situ rotameter style flow meter (ERDCO™ 400 Armor-Flo® meter), constructed with an inline water knockout, to improve the accuracy of the vapor flowrate measurements and allow for water recovery measurements during operation of the wells with a stinger.
6.2.1.5. DESCRIPTION OF CURRENT SYSTEM
As summarized on Table 6-1, there are currently 118 extraction wells considered to be part of the vapor extraction system and 29 wells that were not considered to be part of the SVE system. The following is a summary of the 29 wells that are not considered to be a part of the system:
- Wells HSVE-001S, HSVE-002S, HSVE-002D, HSVE-011S, HSVE-011D, HSVE-025S, HSVE-026S, and HSVE-027S were previously plugged and abandoned.
- Wells HSVE-005S and HSVE-005D were replaced with well HSVE-005R
- Wells HSVE-006S and HSVE-006D were replaced with well HSVE-006R. These wells remain in place but are not operated.
- Well HSVE-006R2 was installed but never connected to the SVE system.
- Wells HSVE-008S and HSVE-008D are inoperable as the control vaults were previously removed.
- Wells HSVE-013 through HSVE-016 were installed within the Village of Hartford combined sewer line pipe bedding along East Watkins Street and are no longer routinely operated.
- Well HSVE-028D is not useable due to a collapsed well screen.
- Well HSVE-030D is not useable due to a blocked transmission line.
- Well HSVE-031S has not been operated since installation according to historical data.
- Well HSVE-031DP is a one-inch probe collocated with well HSVE-031D and is not operated.
- Well HSVE-032H is a horizontal vapor extraction well and is not operated.
- Wells HSVE-056, HSVE-059, and HSVE-075 are no longer operable. The vacuum lines and control vaults for these three wells were repurposed for newly installed wells HSVE-109 through HSVE- 111.
- Wells MPE-A001 through MPE-A005 were installed within the Main Sand stratum in order to conduct MPE pilot testing in Area A. These well are typically occluded and cannot be operated unless groundwater conditions within the Main Sand are unconfined and the well screens are exposed.
In addition, there are four extraction wells (HSVE-009S, HSVE-009D, HSVE-010S, and HSVE-010D) that have been inoperable due to a blockage within the transmission lines connecting the wells to the vapor collection system. Multiple attempts have been made to clear the transmission lines over the past decade. However, these efforts have proved to be either ineffective or short lived.
Cross sections showing the screen interval for the extraction wells relative to the lithology and historical LNAPL distribution, as well as the effectiveness monitoring well network and closest structures are provided in Appendix B. As shown on Figure 6-5, the lines of section are parallel with Watkins, Forest, Elm, Date, Birch, and Cherry Streets, extending from west to east across the Hartford Site. The cross sections in Appendix B include extraction wells, structures, and effectiveness monitoring locations situated approximately 150 feet to the north and south of the line of section, with the exception of the cross section along Birch Street (Appendix B-6), which was projected further to the north to capture monitoring locations and extraction wells around the Hartford Community Center. In some cases, an extraction well, effectiveness monitoring location, or structure may be depicted on more than one cross section depending on its proximity to two lines of section.
6.2.2. STINGERS
After startup of the Phase I and II vapor extraction wells, it was determined that groundwater levels would increase within many of the extraction wells under typical system vacuum, which led to screen occlusion and limited vapor recovery. This did not occur during the SVE pilot test performed in
HSVE-001D in 2004 (Clayton 2004a). Therefore, many of the extraction wells were retrofitted to allow for the installation of a stinger and extraction of groundwater as part of normal operations. A stinger is a small diameter hose or pipe that is inserted into the recovery well, which allows for simultaneous extraction of groundwater and soil vapor. This configuration, typically referred to as MPE, or more specifically as two-phase extraction (TPE), allows for dewatering and prevents occlusion of the screen within the extraction well during operation. As groundwater begins to rise due to the applied vacuum, both groundwater and vapor are extracted through the stinger. The depth of the stinger can be adjusted to depress the water level in the extraction well. The stinger designs, summarized on Table 6-1, vary from well to well. Typical stinger configurations are shown on Figure 6-6 and described as follows.
- Flow Tube – Flow tubes consist of a 2-inch polyvinyl chloride (PVC) stinger that is installed several feet into the 4-inch well casing. Flow tubes were only installed in the Phase I and II wells. Currently, only five of the extraction wells contain flow tubes.
- Straw Stinger – Straw stingers consist of between 0.5-inch and 1-inch flexible hose that tees from the SVE conveyance line within the well control vault and is extended into the extraction well vault via a separate conduit. Within the Phase I and Phase II wells, the straw stinger extends directly from the SVE conveyance line into the extraction well (or in other words there is no conduit for the stinger). The flexible hose is placed through the well cap and into the well casing. A 1-inch diameter PVC pipe is connected to the end of the flexible hose and extends down to the upper portions of the water table, serving as the stinger. Vacuum for the straw stinger and the extraction well is controlled separately in wells with a straw stinger. A ball valve is used to direct flow from the SVE conveyance line to the stinger and vacuum is not applied to the extraction well when a straw stinger is in use. Groundwater is extracted using an airlift technique wherein air moving at high velocity entrains water droplets at the air-water interface and conveys them upward through the stinger. The terminal end of each stinger consists of a beveled tip, which allows for continued airflow at high velocity and reduces the likelihood of deadheading (i.e., no movement of air or water). Currently, 37 wells have straw stingers installed.
- Viton® Seal Stingers – Viton® seal stingers are between 0.75 and 1.5-inch diameter PVC stingers that are installed through a Viton® seal which is set just below the 4-inch by 4-inch by 2-inch tee within the extraction well. Viton® is a chemical and heat resistant polymer that is used to create an airtight seal with the well casing and around the stinger. The Viton® seal is placed near the top of the well casing, below the tee, where vacuum is applied to the extraction well. Like the straw stinger design, the stinger extends to the water table and the tip of the stinger is cut at a 45-degree angle to assist with initial mixing of air and water. The groundwater and soil vapor are transmitted through the stinger to the top of the well above the Viton® seal and then conveyed through the 2-inch line that connects the wellhead to the control vault. There are currently 35 wells with Viton® Seal Stingers that are considered part of the vapor collection system.
6.2.2.1. TOTAL PHASE EXTRACTION TEST
In some portions of the Hartford Site (primarily Effectiveness Zone 5 and Zone 6), extraction wells installed within the North Olive stratum have been largely operable, whereas wells installed within the deeper Rand stratum are largely inoperable due to the well screens being occluded with groundwater throughout the year. As described in Section 4.1, residual LNAPL within the North Olive stratum has been largely depleted via operation of the SVE system and natural smear zone depletion processes, whereas, LNAPL remains present in the Rand stratum, as well as the deeper, more permeable Main Sand stratum beneath Effectiveness Zone 6. Therefore, it was hypothesized that increased water production rates within the wells screened in the Rand stratum would draw down the water table in the vicinity of the operating well and could result in improved mass recovery rates.
In order to determine if increasing water recovery using existing SVE wells and infrastructure would result in (1) exposure of the screen in the operating wells, (2) sustained unsaturated conditions within the extraction wells and nearby monitoring locations, and (3) increased mass removal rates for petroleum hydrocarbons, an enhanced TPE test was conducted between March 1 and March 11, 2016, within three extraction wells installed in the Rand stratum along North Olive Avenue within Effectiveness Zone 6. To optimize the likelihood of additional mass recovery, the enhanced TPE test was performed when groundwater elevations within the Rand stratum were below the system trigger levels in three of the five trigger monitoring locations, as described in the Final Vapor Collection System OMM Plan (Trihydro 2015b).
The vapor extraction network in Effectiveness Zone 6 was evaluated to determine which wells would be best suited for the enhanced TPE test. Extraction wells HSVE-057, HSVE-059, and HSVE-060, were selected based on the following criteria:
- The wells are proximal to one another and screened entirely within the Rand stratum (i.e., do not appear to have a screen interval that extends into the overlying B-Clay)
- The wells have remained inoperable due to occlusion of the screen with groundwater since installation
- The three extraction wells are installed within or adjacent to LNAPL source zones based on LIF, dissolved phase, and vapor phase monitoring results
Prior to conducting the test, the existing ½-inch inner diameter (ID) straw stingers installed within wells HSVE-057, HSVE-059, HSVE-060 were replaced with 1-inch ID clear braided straw stingers to improve water and vapor recovery rates. The newly installed stingers were equipped with a cam-lock fitting to allow for the use of a portable flowmeter and water knock out tank to measure the rate of vapor and groundwater recovery. At the start of the enhanced TPE test, the groundwater within each of the test wells was removed using the existing straw stinger. The straw stinger was slowly lowered to extract groundwater and expose a minimum of 2 feet of well screen. This process took approximately 20 minutes at each of the extraction wells. The volume of water removed prior to the start of the test was between 11.5 gallons (well HSVE-060) and 14.2 gallons (well HSVE-059), which is minimal compared to the overall volume of groundwater recovered during the enhanced TPE test (approximately 20,000 gallons). During the enhanced TPE test, the valves controlling vapor and groundwater flow were completely opened within the three extraction wells and the full system vacuum was directed through the straw stingers to maximize the rates of recovery.
During the 11-day enhanced TPE test, approximately 20,000 gallons of perched groundwater was removed from the three test wells, with an average water removal rate from each extraction well as follows:
- HSVE-057: 0.60 gpm, or 863 gallons per day (gpd)
- HSVE-059: 0.50 gpm (714 gpd)
- HSVE-060: 0.27 gpm (386 gpd)
In addition to the water removal rates estimated for each well using the in-line knockout tank, water removal rates were also measured at the thermal treatment system. Prior to the start of the test, the water removal rate for the entire SVE system was 1,000 gpd as recorded on February 29, 2016.
During the enhanced TPE test the water removal rate increased to between 2,600 and 2,800 gpd. Following the enhanced TPE test, the water removal rate decreased to 1,400 gpd, as recorded on March 14, 2016. At the end of the test, the river stage increased, and 0.3 inches of precipitation was recorded between March 10 and 11, 2016, which would have resulted in increased water removal rates following completion of the test. Based on the aggregate measurements recorded at the thermal treatment system, it is estimated that the combined water removal rate from the three wells utilized during the enhanced TPE test was between 1,200 to 1,800 gpd. The estimated average groundwater extraction rate for the enhanced TPE test using data collected from each well using the knockout tank was 1,963 gpd, slightly higher than the maximum estimated using the aggregate flowrate measurements from the treatment system.
Water generated from these three wells during the enhanced TPE test accounted for approximately 70% of the total water generated from the vapor collection system over the 11-day test. Drawdown averaged 13.5 feet, resulting in exposed screens of 3.5 and 4.75 feet within the extraction wells.
Perched water within the Rand stratum was depressed by an average of 2.0 feet in the adjacent monitoring locations.
Vapor flow was negligible within each of the extraction wells until March 4, 2016, four days after the start of the test. Between March 4 and 8, 2016, airflow was only measured within well HSVE-059. The following table presents airflow and corresponding mass removal rates in pounds per day (lbs/day) recorded during the final four days of the enhanced TPE test.
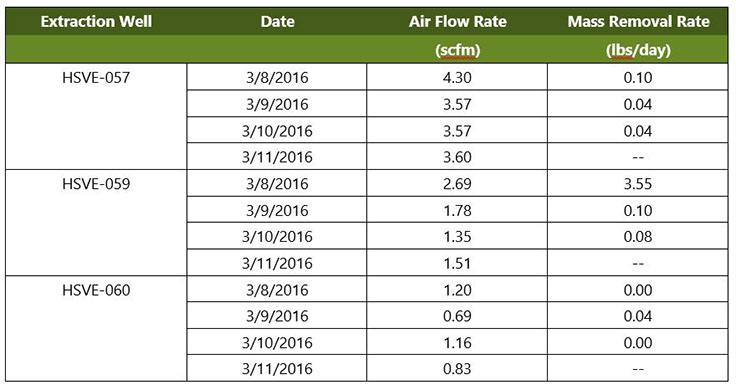
The maximum cumulative mass recovery rate from the three wells during the enhanced TPE test was 3.65 lbs/day (March 8, 2016). For comparison, the estimated mass recovery rate from the entire vapor collection system during March 2016 was 4,285 lbs/day. The mass of volatile petroleum hydrocarbons recovered during the test wells represented 0.09% of the mass recovery from the entire SVE system during the 11-day test.
While the enhanced TPE test showed that increasing the rate of water intake would allow for sporadic operation of the SVE wells installed within the Rand stratum within Effectiveness Zone 6, the rate of water recovery compared to the rate of hydrocarbon mass recovery indicates that this approach is not practicable even under seasonal low water level conditions. Significant reconfiguration of the SVE and thermal treatment systems, would be necessary to handle the additional volume of water if the wells installed within the Rand stratum in Effectiveness Zone 6 were operated in this manner in the future, which is not supported by the results of the enhanced TPE test.
6.2.3. MODIFICATIONS TO CONTROLS AND WELLHEAD COMPLETIONS
Beginning in April 2017, the controls and wellhead completions for the existing extraction wells were retrofitted to allow the use of an ex-situ flow meter. Retrofitting these wells involved the removal and replacement of the existing controls, Venturi flowmeter (if present), and wellhead completions. The use of an ex-situ rotameter style flow meter (ERDCO™ 400 Armor-Flo® meter), which was designed with an inline water knockout, allows for improved accuracy of the vapor flowrate measurement, as well as measuring the rate of water recovery during operation of the wells with a stinger. Typical details for the modified controls and wellhead completions are shown on Figure 6-4. Currently, 39 extraction wells have been installed or modified to allow the use of the ex-situ device for measuring vapor and water recovery rates, as summarized in Table 6-1. It is anticipated that the remaining operable extraction wells will be modified in 2018.
6.2.4. THERMAL TREATMENT SYSTEM
The extraction wells are connected to horizontal conveyance lines through a series of 32 system control vaults (V1 through V32), depicted on Figure 3-2. The horizontal conveyance lines converge within a large vault (referred to as the Main Vault) near the intersection of North Olive Avenue and East Elm Street, and continue to the east, via a single 12-inch pipeline (referred to as the Main Header), beneath the railroad right-of-way to the thermal treatment system located on the Premcor facility.
System vacuum is induced using one or more of the four 75 HP belt drive blowers (B-1 through B-4). Typically, two blowers, but no more than three, are functioning simultaneously depending on the number of extraction wells being operated and the cumulative flowrate through the SVE system. ecovered vapors are passed through a 470-gallon condensate tank followed by a 1,000-gallon aboveground vapor-liquid separator, as well as four individual 240-gallon vapor-liquid separators prior to each of the four blowers. It should be noted that the thermal treatment system was not constructed with an oil water separator, and therefore extracted water cannot contain LNAPL.
After passing through the vapor-liquid separators and blowers, the recovered vapor is treated via four thermal oxidizers (TO-1 through TO-4). Each thermal oxidizer has a 5 HP combustion air blower and a 7.5 HP tertiary air fan. The combustion air blower introduces ambient air to the burner that mixes with natural gas to maintain the flame. The burner creates a ring of flame around the port through which recovered vapor enters the combustion chamber. A motor operated valve on the tertiary air fan opens when the combustion temperature exceeds a high temperature set point (1,600 degrees Fahrenheit [°F]). This can occur during periods when TVPH concentrations (which includes methane) in the recovered soil vapor are elevated, which last occurred during low water table conditions in February 2013. The Federally Enforceable State Operating Permit requires that the combustion temperature in each operating thermal oxidizer remains above 1,400° F. The actual operating temperature is adjusted to approximately 1,460° F to allow for normal temperature fluctuations. The thermal treatment system will shut down if the operating temperature drops below 1,405° F, to eliminate the potential for a violation of the permitted temperature limits.
The individual blowers have maximum flow capacities ranging from approximately 600 to 850 scfm. Each thermal oxidizer is capable of processing up to 1,000 scfm with a TVPH concentration of up to 50,000 parts per million by volume (ppmv), while achieving a destruction efficiency of 99 percent.
6.2.5. ROUTINE SVE SYSTEM MONITORING
Monitoring of the SVE system is performed on a bimonthly basis to evaluate the performance of each of the extraction wells. Routine monitoring includes: (1) gauging fluid levels within the extraction well, (2) measuring the vacuum within the extraction well casing and transmission line prior to the extraction well, (3) collecting differential pressure and temperature measurements for estimating vapor flowrates (or alternatively directly measuring flow and water recovery rates in the 39 extraction wells that were modified or connected to the system in 2017), and (4) collecting a soil vapor sample for screening TVPH, lower explosive limit (LEL), and fixed gas (oxygen, carbon dioxide, and methane) concentrations. Adjustment to the individual wells is conducted the week following routine monitoring, after a review of the data is completed.
Routine monitoring is also performed at the thermal treatment system. Of note, the total influent flowrate at the Main Header and collection of an influent vapor sample for field screening purposes has been performed on weekly basis. The influent vapor sample is screened for TVPH, LEL, and fixed gas (oxygen, carbon dioxide, and methane) concentrations. In addition, an influent sample is collected from the Main Header at least once each month and submitted for laboratory analysis of total petroleum hydrocarbons, speciated volatile petroleum hydrocarbons, and methane.
The mass removal rate is estimated on a monthly basis using the flowrate and petroleum hydrocarbon concentrations for each of the individual SVE extraction wells. In addition, the total mass recovered from the SVE system is estimated based on both analytical and field data collected from the Main Header using the following equation (USEPA 1989)2:
𝑀 = 𝐶 × 𝑄 × 𝑀𝑊 × 1.581𝐸-07 × 24 ℎ𝑜𝑢𝑟𝑠/𝑑𝑎𝑦
Where:
M = Mass removal rate (lbs/day)
C = TVPH concentration in soil vapor (ppmv) Q = Vapor extraction flowrate (scfm)
MW = Molecular weight (pounds per pound mole (lb/lb-mole)), which is 86.6 lb/lb-mole as reported by the analytical laboratory
The results of the SVE system monitoring and extraction well adjustments have been reported on a routine basis to the USEPA and Illinois EPA within semiannual operations, monitoring, and maintenance reports since April 2015. This data will not be described herein. However, an evaluation of the mass recovery rates from the system, each effectiveness zone, and individual extraction wells is included in the following three subsections.
6.2.5.1. MASS RECOVERY VIA THE SVE SYSTEM
As shown on Figure 3-1, more than 1.0 million gallons of volatile petroleum hydrocarbons have been recovered via the SVE system since 2005. Mass recovery was initially high following expansion of the system, with startup of new extraction wells occurring frequently between 2005 and 2008. Mass recovery rates subsequently decreased through 2012, which would be expected as asymptotic conditions within the individual extraction wells were achieved. However, mass recovery rates subsequently increased between 2012 and 2015, in response to regionally low groundwater elevations and focused pumping pilot testing performed over this timeframe (discussed in Section 4.3.3). There was also an effort to improve mass recovery in late 2012 and early 2013, by connecting multipurpose monitoring points, groundwater monitoring wells, and large diameter recovery wells to the SVE system using 2-inch aboveground, temporary hoses.
The use of temporary hoses to connect wells to the system was further evaluated as part of the Effectiveness Zone 6 Optimization Report (212 Environmental 2016c). It was determined that the majority of the vapor recovered between late 2012 and early 2013 originated from Effectiveness Zone 6, where recovery well RW-002 was connected to the SVE system using temporary hoses. This recovery well had measurable LNAPL during this timeframe, which likely resulted in high rates of mass recovery due to partitioning of vapor from the large LNAPL-air interface within the 30-inch recovery well, and not necessarily attributed to enhanced recovery of volatile petroleum hydrocarbons partitioning within soil vapor. It is important to note that recovery from this well was limited to vapor recovery and did not include the removal of any groundwater or LNAPL.
Since 2012, mass recovery rates have decreased partially due to higher groundwater elevations and also due to asymptotic conditions being reached in the extraction wells. In some cases, pulsed or cyclical operations have improved mass recovery within individual extraction wells by allowing vapor concentrations to rebound and then operating the well as needed to recover accumulated volatile petroleum hydrocarbons. Pulsed operation is typically performed in wells that are located in Effectiveness Zone 3 and Zone 4.
6.2.5.2. MASS RECOVERY BY EFFECTIVENESS ZONE
The cumulative mass recovery rate was evaluated within each effectiveness zone using data collected between April 2015 and December 2017, as shown on Figure 6-7. The mass recovery rates vary significantly from month to month, which is believed to be attributed to changes in soil moisture content due to precipitation infiltration and changes in groundwater elevations within the hydrostratigraphic units, which effect the soil gas permeability, partitioning of volatile constituents from the LNAPL source zone, and occlusion of the well screens during vapor extraction. Ultimately, changes in groundwater elevations and moisture content affect which extraction wells can be operated. In addition, routine maintenance (such as removing sediment that accumulates within the extraction wells or cleaning biofouling within stingers) also results in fluctuations in the mass recovery rates within the extraction wells.
The lowest monthly mass recovery rates were observed between July and August 2015, January 2016, and again between May and July 2017. These low vapor recovery rates occurred during months following major flooding of the Mississippi River stage, when soil moisture content and groundwater elevations were elevated within each of the hydrostratigraphic units.
Since April 2015, mass recovery was highest within Effectiveness Zone 2 and Zone 5, with a monthly average of 860 and 930 lbs/day, respectively. The lowest mass recovery rates were observed in Effectiveness Zone 3 and Zone 4, with an average monthly mass recovery rate of 7 and 65 lbs/day.
6.2.5.3. MASS RECOVERY FROM INDIVIDUAL EXTRACTION WELLS
Mass recovery rates for individual extraction wells operating in May and November 2017 are shown in Appendices G-1-3 and G-1-4 for wells screened in the North Olive stratum, and Appendices G-2-3 and G-2-4 for wells screened in the Rand stratum. In general, mass recovery rates were higher within the extraction wells in November compared to May 2017. The most significant increase in mass recovery rates were observed in Effectiveness Zone 5 and 6 in the North Olive stratum, as well as Effectiveness Zone 2 and Zone 5 in the Rand stratum. As previously stated, this difference is likely attributed to the difference in soil moisture content and groundwater elevations during these two quarterly events (further described in Section 6.3.3).
The TVPH distribution within the North Olive and Rand stratum, modeled using the effectiveness monitoring data collected in May and August 2017 (described in Section 6.3.4), are also depicted on the figures included in Appendix G-1-3, Appendix G-1-4, Appendix G-2-3, and Appendix G-2-4.
Within the North Olive stratum, the extraction wells with the highest mass recovery rates were generally collocated with elevated TVPH concentrations measured in soil vapor, with two exceptions.
- Elevated TVPH concentrations were observed in the alley between West Birch and Cherry Streets in SVE Effectiveness Zone 1 during May 2017. As described in Section 6.2.1.4, existing extraction well HSVE-104 (previously installed at the west end of the ally) and new extraction well HSVE-113 (installed at the east end of the ally in May 2017) were connected to the SVE system in June 2017. TVPH concentrations were significantly lower in November 2017 between West Birch and Elm Streets following startup of these two extraction wells.
- Elevated TVPH concentrations are observed between North Olive and Delmar Avenues (Effectiveness Zone 1 and 6). Many of the SVE extraction wells in this area are typically occluded and are not operable. Additional SVE wells (HSVE-108, HSVE-110, and HSVE-111) and existing wells HSVE-001D and HSVE-030S were connected to the Phase III transmission system in June 2017 to enhance vapor recovery in the northern portions of Effectiveness Zone 6. The TVPH concentrations within soil vapor samples collected from these wells have remained relatively low (less than 1,000 ppmv) since installation.
Locations with higher mass recovery rates in the Rand stratum are generally not collocated with elevated TVPH concentrations measured in soil vapor, with a few exceptions such as wells HSVE-47, HSVE-52, HSVE-53, HSVE-072, and HSVE-113. This is likely attributed to the fact that many of the wells screened in the Rand stratum in Effectiveness Zones 5 and 6 remain occluded throughout the year and therefore vapor extraction was not feasible. The majority of vapor extraction wells that had higher mass removal rates in May and November 2017 were located at or beyond the lateral edge of the Rand stratum (in which case the SVE wells are screened in the Main Silt at an elevation similar to the wells screened in the Rand stratum).
6.2.6. SVE SYSTEM LIMITATIONS
Despite the conversion of many of the wells from SVE to TPE using stingers, there are several extraction wells, primarily located within the eastern portion of Effectiveness Zone 6 along North Olive Avenue and screened within the Rand stratum, that are generally inoperable due to continuous occlusion of the well screen. It is possible that some of these wells could be operable if water intake were not limited. However, as discussed in Section 6.2.2.1, based on the enhanced TPE test conducted in Effectiveness Zone 6, this may not significantly increase mass recovery. There are 16 extraction wells that are generally not operable due to well screen occlusion including:
- Zone 1: HSVE-105D and HSVE-107D
- Zone 2: HSVE-044 and HSVE-045
- Zone 6: HSVE-055, HSVE-056, HSVE-057, HSVE-059, HSVE-060, HSVE-063, HSVE-065, HSVE-066, HSVE-068, HSVE-069, HSVE-073, and HSVE-075
The number of wells that are occluded increases significantly following major flooding of the Mississippi River, further limiting mass recovery via the vapor extraction system, as observed between July and August 2015, January 2016, and again between May and July 2017. During periods of major flooding, TVPH concentrations increase within soil vapor in the shallow subsurface, as observed in May 2017 (as depicted in Appendix G-1-3). The system is monitored closely during these events and wells are brought back online as quickly as possible to mitigate the vapor intrusion pathway as well as improve mass recovery. However, this requires that soil moisture and/or groundwater elevations decrease. Until these conditions are met, little can be done to operate occluded wells.
6.3. SOIL VAPOR MONITORING
An initial evaluation of the distribution of volatile petroleum hydrocarbons and methane was proposed in 2004 and intended to assess the vapor intrusion pathway beneath twelve structures located on East Maple and East Watkins Streets (ENSR 2004a). However, access was only provided at two structures, neither of which was located on East Maple or Watkins Street (507 North Olive Street and the Hartford Community Center); therefore, a supplemental assessment was proposed that included installation of nested vapor monitoring wells and vapor probes in the Village of Hartford rights-of-way across the Hartford Site (ENSR 2004b). The initial and supplemental evaluations included installation of 107 nested soil vapor monitoring probes at 41 locations between March and September 2004, to assess the lithology and distribution of volatile petroleum related constituents within the various lithologic units (ENSR 2004c). In addition, by August 2004, more than 160 multipurpose monitoring points were installed to assess the effectiveness of the expanded SVE system (ENSR 2004c).
As part of this initial investigation, soil vapor samples were collected from approximately 180 nested soil vapor monitoring probes and multipurpose monitoring points for analysis within both on-site and off-site laboratories. The results of these initial investigations provided the basis for a preliminary vapor CSM including a description of the nature and extent of petroleum related vapors beneath the Hartford Site, potential migration through the various hydrostratigraphic units, as well as migration through utility corridors into overlying structures as presented in the Vapor Migration Pathway Assessment Report, Hartford Area Hydrocarbon Plume Site, Hartford, Illinois (ENSR 2004c). It was concluded that while the incidents of a completed vapor intrusion pathway were intermittent and potentially attributed to a number of factors, the correlation of these factors was not well understood. Therefore, it was recommended that additional monitoring be conducted to understand the temporal relationship between a completed vapor intrusion pathway and potential influencing factors such as water table fluctuations, river stage, barometric pressure, and precipitation events (ENSR 2004c).
An additional assessment was performed between January and March 2005 to further refine the preliminary vapor CSM, including installation of an additional 123 nested soil vapor monitoring probes at 42 monitoring locations. Soil vapor samples were collected from 205 soil vapor probes, as well as 166 monitoring points (installed to assess the effectiveness of Phase I and II expansion of the SVE system) for laboratory analysis (ENSR 2005).
6.3.1. HISTORICAL EFFECTIVENESS MONITORING
Following completion of the initial assessments in 2004 and the investigation in 2005, soil vapor samples were not routinely collected for laboratory analysis. The following summarizes the number of soil vapor samples that were collected from the nested soil vapor monitoring wells, vapor probes, and multipurpose monitoring points between May 2005 and August 2008, after which no additional soil vapor samples were collected for laboratory analysis.
- May through November 2005 – Vapor samples were collected from 18 locations
- January 2006 - Vapor samples were collected from 10 locations
- May 2007 - Vapor samples were collected from 30 locations
- August 2008 - Vapor samples were collected from 2 locations
However, beginning in May 2005, routine field screening within the nested soil vapor monitoring wells, vapor probes, and multipurpose monitoring points commenced to evaluate the effectiveness of the expanded SVE system (discussed in Section 6.2.1). Routine field screening included:
- Measuring static pressure or vacuum in each monitoring location
- Collecting a soil vapor sample into a Tedlar bag from each monitoring location for screening of TVPH and fixed gas (including methane, oxygen, and carbon dioxide) concentrations, as well as LEL
Effectiveness monitoring was conducted to provide data to support adjustments to the individual extraction wells, as well as assess the need for further modifications to the overall system. The objectives of the effectiveness monitoring program, as described in the draft Effectiveness Monitoring Plan (ENSR et al. 2005) were to:
- Determine if an adequate pneumatic influence was present to mitigate the vapor intrusion pathway beneath structures
- Determine if TVPH and methane concentrations were present at elevated concentrations in the shallow subsurface beneath structures
Effectiveness monitoring was initially conducted on a biweekly basis by the Hartford Working Group beginning in May 2005. Biweekly sampling continued through April 2006, at which point the sampling frequency was reduced from biweekly to monthly. Monthly effectiveness monitoring continued from April 2006 until March 2011. It should be noted that over this same timeframe (between August 2005 and March 2008), an additional 135 multipurpose monitoring points were installed to evaluate the Phase III expansion of the SVE system. Effectiveness monitoring was suspended in March 2011.
6.3.2. RECENT EFFECTIVENESS MONITORING
Monthly effectiveness monitoring by the Hartford Working Group resumed in September 2013 and continued through April 2014, at which point the frequency was reduced from monthly to quarterly. Apex assumed responsibility of the effectiveness monitoring program in May 2015, following the procedures described in the Effectiveness Monitoring Plan (URS 2014) including:
- Measuring static pressure or vacuum in each monitoring location
- Collecting a soil vapor sample into a Tedlar bag from each monitoring location for screening of TVPH and fixed gas (including methane, oxygen, and carbon dioxide) concentrations, as well as the LEL
- Gauging fluid levels within each of the monitoring locations that are 1-inch or more in diameter
In addition, beginning in May 2015 the soil gas permeability of the sediments around the screen interval at each monitoring location were estimated via pneumatic testing performed while purging soil vapor from the location prior to collecting a Tedlar bag. While the sampling protocols for the effectiveness monitoring program have remained similar since the inception of the program, the sample locations have varied from event to event, partly based on whether the monitoring well screen was occluded with groundwater at the time of sampling. Between September 2013 and February 2017, the quarterly effectiveness monitoring network included 146 monitoring locations including vapor monitoring probes (VMPs), vapor probes (VPs), multipurpose monitoring points (MPs), and groundwater monitoring wells (HMWs), generally screened in the A-Clay, North Olive stratum, and B-Clay. The monitoring network was expanded in May 2017 to include approximately 30 monitoring locations screened within the Rand stratum. The current effectiveness monitoring network is shown on Figure 6-5. Many of the monitoring locations are nested to allow evaluation of the effectiveness of the SVE system within the various clay layers and hydrostratigraphic units.
6.3.3. SOIL VAPOR SOURCE DISTRIBUTION
Select analytical and field screening data collected from the effectiveness monitoring network was used to evaluate the spatial (vertical and horizontal) distribution of the vapor source and to determine if the distribution of volatile petroleum hydrocarbons has changed since startup of the expanded SVE system. As previously described, vapor samples were primarily collected for laboratory analysis in 2004 and 2005, and samples have not been collected for laboratory analysis since 2008. Therefore, the analytical data can be used to understand the historical soil vapor source but does not allow for an evaluation of current conditions. To better understand the current vapor source distribution, the effectiveness monitoring field screening results were also used to model the vapor source for select historical and current monitoring events, which were compared to the vapor source distribution modeled using the historical analytical results. Distribution profiles were developed using a linear interpolant model created in three dimensions within Leapfrog® Hydro. A description of these evaluations is provided in the subsections below.
6.3.3.1. DISTRIBUTION BASED ON ANALYTICAL DATA
The historical soil vapor source distribution beneath the Hartford Site was evaluated using the analytical results for samples collected in 2004 and 2005. Benzene and isopentane were selected as representative constituents of the volatile petroleum hydrocarbon source because they are two of the most prevalent volatile constituents present in the LNAPL smear zone. In addition, benzene is commonly used as a primary indicator for pathway analyses at petroleum vapor intrusion sites because of its relatively high abundance, volatility, and toxicity making it a human health risk driver (ITRC 2014). As shown on Figure 6-8 and Figure 6-9, the distribution of benzene and isopentane were considered for low and high river stage conditions, such that the analytical results for samples collected when the Mississippi River (measured at the Mel Price Lock and Dam) was above 405 ft- amsl (average elevation between 2004 and 2017) were included in the high river stage category, while the results for samples collected when the Mississippi River was below 405 ft-amsl were included in the low river stage category. A value of one-half the detection limit was used when the analytical results were reported as non-detect for benzene or isopentane within a soil vapor sample.
In general, isopentane was reported at higher concentrations and across a greater portion of subsurface underlying the Hartford Site compared to benzene. Benzene was generally observed at elevated concentration (exceeding 100 milligrams per cubic meter (mg/m3)) in small disconnected zones, most prominently between East Date and East Watkins Streets. Whereas, isopentane was observed at elevated concentrations (exceeding 1,000 mg/m3) across broader, connected areas within the unsaturated zone. Concentrations of benzene and isopentane were generally higher and present at shallower depths during high river stage conditions compared to low river stage conditions. Under low water table conditions, the linear interpolant 3D model shows that elevated isopentane concentrations (exceeding 1,000 mg/m3) were generally observed beneath the following areas within each of the hydrostratigraphic units:
- Basement Level – Between the northeast limits of East Rand Avenue and East Birch Street, along North Olive Avenue
- North Olive Stratum – Between East Rand Avenue and East Elm Street, as well as the Hartford Community Center
- Rand Stratum – Between East Rand Avenue south to East Maple Street
- Main Sand Stratum – Between East Rand Avenue south to East Maple Street, as well as the Hartford Community Center
Under high water table conditions, the linear interpolant 3D model shows elevated isopentane concentrations (exceeding 1,000 mg/m3) were generally observed within the following areas beneath the Hartford Site within each of the hydrostratigraphic units
- Basement Level – Between East and West Rand Avenue south to East Date Street (including the Hartford Community Center), as well as the central portions of the Village between East Date and East Maple Streets.
- North Olive Stratum – Between East and West Rand Avenue south to East Cherry Street (including the Hartford Community Center), as well as the central portions of the Village between East Elm and East Watkins Streets.
- Rand Stratum – Between East Rand Avenue south to East Maple Street, as well as the Hartford Community Center
- Main Sand Stratum – Between East and West Date Streets south to East Maple Street
6.3.3.2. DISTRIBUTION BASED ON FIELD SCREENING RESULTS
In addition to evaluating the effectiveness of the SVE system, the effectiveness monitoring field screening results can be used to understand the distribution of TVPH and fixed gases over time, under a variety of hydraulic conditions. While the analytical data collected from the effectiveness monitoring network is limited to historical conditions, the effectiveness monitoring data is expansive, having been collected from hundreds of monitoring locations over 13 years and under a variety of seasonal conditions. Distribution plots of TVPH, oxygen, and carbon dioxide were developed for historical and recent effectiveness monitoring events. There were four effectiveness monitoring events that were modeled representing low and high groundwater elevations within the Main Sand stratum as follows:
- January 2006 – Groundwater elevations within the Main Sand stratum representing the 15th percentile (historical low groundwater conditions)
- April 2008 - Groundwater elevations within the Main Sand stratum representing the 90th percentile (historical high groundwater conditions)
- May 2017 - Groundwater elevations within the Main Sand stratum representing the 90th percentile (recent high groundwater conditions)
- November 2017 - Groundwater elevations within the Main Sand stratum representing the 35th percentile (recent low groundwater conditions)
The interpolant model incorporated data collected from the monitoring locations screened during each of these quarterly effectiveness monitoring events. A slicing plane was then created at an average representative elevation for the North Olive stratum and Rand stratum. The following subsections describe the inputs and results of the 3D visual analysis for the TVPH, oxygen, and carbon dioxide data recorded during the historical and recent regional effectiveness monitoring events.
6.3.3.2.1. NORTH OLIVE STRATUM
An elevation of 418 ft-amsl was estimated as the representative horizontal slicing plane for the North Olive stratum (or Main Silt stratum, where the North Olive stratum is not present) based on the average midpoint of the screen interval for monitoring locations installed within this stratum. As shown on the figures included in Appendix G-1, data from monitoring locations with screen intervals located within +/- 4 feet of the slicing plane are shown on the figures presenting the distribution of TVPH, oxygen, and carbon dioxide.
The TVPH distribution in the North Olive stratum during the January 2006, April 2008, May 2017, and November 2017 effectiveness monitoring events are depicted in Appendix G-1-1 through Appendix G-1-4, respectively. The distribution of TVPH was generally similar during the historical and recent monitoring events, with higher TVPH concentrations generally observed in three portions of the Hartford Site.
- In the northern portion of Effectiveness Zone 1 between West Rand Avenue and West Cherry Street, including the Hartford Community Center
- In the northern portion of Effectiveness Zone 6 between East Rand Avenue and East Birch Street
- At the northern and western boundary of Effectiveness Zone 5 where it abuts the southern limit of Effectiveness Zone 6 and the eastern limit of Effectiveness Zone 2, generally between East Date and Elm Streets
Comparing the four effectiveness monitoring events, the TVPH concentrations were generally lowest during the April 2008 event, which was conducted between April 15 and 16, 2008, shortly following a river stage triggered event (labeled as EBMP-E on Figure 6-10). The TVPH concentrations were generally highest during the May 2017 event, which was conducted between May 15 and 18, 2017, shortly following river stage triggered event EBMP-34 (as shown on Figure 6-11). Groundwater and river stage elevations were similar during the April 2008 and May 2017 events.
It is possible that the difference in the TVPH concentrations measured in the North Olive stratum during these two effectiveness monitoring events (performed when groundwater elevations in the Main Sand was measured at the 90th percentile), reflects a difference in the mass recovery rates from the vapor extraction wells. The May 2017 effectiveness monitoring event was performed approximately one week following heavy precipitation (approximately 11 inches of rainfall) and the sixth highest Mississippi River stage recorded at the Mel Price Lock and Dam (cresting at 34.86 feet on May 6, 2017, above the 34-foot major flood stage indicator). Water recovery rates across the SVE system were reported as high as 7,000 gpd and soil vapor extraction rates decreased below 1,000 scfm in the week preceding the start of the May 2017 effectiveness monitoring event. For comparison, the river stage reached a maximum of 25.35 feet in the week prior to the April 2008 monitoring event with water recovery rates reported at a maximum of 2,300 gpd and the vapor flowrate reported between 1,719 and 2,013 scfm across the system.
The oxygen distribution in the North Olive stratum during the January 2006, April 2008, May 2017, and November 2017 effectiveness monitoring events are depicted in Appendix G-1-5 through Appendix G-1-8, respectively. The carbon dioxide distribution in the North Olive stratum during these four effectiveness monitoring events is shown in Appendix G-1-9 through Appendix G-1-12. The distribution of oxygen and carbon dioxide tend to be mirror images of one another with elevated concentrations of carbon dioxide (exceeding 10%) generally observed where oxygen concentrations are reduced (below 5%). Reduced oxygen and elevated carbon dioxide concentrations were typically observed in soil vapor at monitoring locations with elevated TVPH concentrations. The TVPH, oxygen, and carbon dioxide distributions provide evidence that volatile petroleum hydrocarbons are being reduced through: (1) aerobic biodegradation, where microbes are utilizing the petroleum hydrocarbons as a source of energy, and oxygen as an electron receptor for respiration, or (2) methanogenesis where an external electron receptor (such as oxygen) is not necessary to support microbial degradation. In the case of aerobic biodegradation and methanogenesis, carbon dioxide is produced as volatile petroleum hydrocarbons in soil vapor are depleted. This transformation process is referred to as mineralization.
6.3.3.2.2. RAND STRATUM
An elevation of 409 ft-amsl was estimated as the representative slicing plane for the Rand stratum (or Main Silt stratum, where the Rand stratum is not present) based on the average midpoint of the screen interval for monitoring locations installed within this stratum. As shown on the figures included in Appendix G-2, data from monitoring locations with screen intervals located within +/- 4 feet of the slicing plane are represented on the figures presenting the distribution of TVPH, oxygen, and carbon dioxide.
The TVPH distribution in the Rand stratum during the January 2006, April 2008, May 2017, and November 2017 effectiveness monitoring events are depicted in Appendix G-2-1 through Appendix G-2-4, respectively. The distribution of TVPH was generally similar during the historical and recent monitoring events, with higher TVPH concentrations generally observed in two areas of the Hartford Site.
- In the northern portion of Effectiveness Zone 1 between West Arbor and West Date Streets
- Beneath the majority of Effectiveness Zone 5 and Zone 6 between East Rand Avenue and East Forest Streets
Comparing the interpolant models for the four effectiveness monitoring events, the TVPH concentrations were generally higher and observed across a greater portion of the smear zone when groundwater elevations in the Main Sand stratum were less than the 50th percentile of all measurements (January 2006 and November 2017). This may be a result of lower soil moisture content and higher soil vapor permeability when groundwater elevations are lower, allowing for higher rates of diffusion of volatile petroleum related constituents and methane from LNAPL present in the Main Sand stratum into the overlying Rand stratum.
The oxygen distribution in the Rand stratum during the January 2006, April 2008, May 2017, and November 2017 effectiveness monitoring events are depicted in Appendix G-2-5 through Appendix G-2-8, respectively. The carbon dioxide distribution in the Rand stratum during these four effectiveness monitoring events is shown in Appendix G-2-9 through Appendix G-2-12. Similar to the North Olive stratum, the distribution of oxygen and carbon dioxide within the Rand stratum, tend to be mirror images of one another with elevated concentrations of carbon dioxide (exceeding 10%) generally observed where oxygen concentrations are reduced (below 5%). Reduced oxygen and elevated carbon dioxide concentrations were typically observed in soil vapor at monitoring locations with elevated TVPH concentrations. The TVPH, oxygen, and carbon dioxide distributions provide evidence of natural smear zone depletion processes within the Rand stratum, consistent with the North Olive stratum.
6.3.3.3. SUMMARY OF SOIL VAPOR SOURCE MODELING
Modeling of the distribution of the soil vapor source conducted using both historical analytical data and effectiveness monitoring field screening results indicates that the distribution of the soil vapor source is variable primarily as a result of changes in the Mississippi river stage. However, there does not appear to be a significant difference in the extent of vapor source when comparing the historical and more recent distribution of TVPH within the subsurface. While there has been more than 1 million gallons of volatile hydrocarbons removed via the SVE system since 2003, the spatial distribution of the vapor source has not changed significantly and appears to be stable. However, there are areas where vapor concentrations (e.g., Effectiveness Zone 3 and Zone 4) have decreased over time, as discussed in detail in the following section.
6.3.4. TVPH CONCENTRATION TRENDS
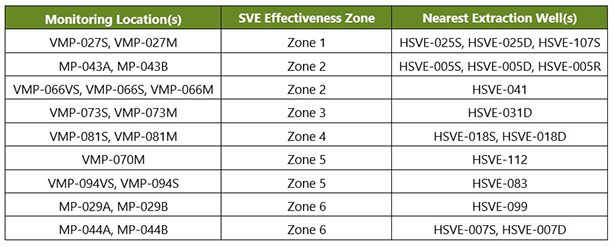
TVPH concentration trends in soil vapor was also evaluated for select monitoring locations within each of the SVE Effectiveness Zones. TVPH concentrations were plotted along with the Mississippi River elevation. Nested monitoring locations were typically selected, with one location screened within the shallow subsurface (A-Clay or North Olive stratum) and another screened deeper (B-Clay, Rand stratum, or Main Silt stratum) to allow for evaluation of vertical trends. Additionally, the operability of the nearest SVE well was also included to correlate TVPH concentration trends with both the river stage, as well as SVE system operation. The TVPH concentration trends, included on the figures within Appendix H, were considered for nine effectiveness monitoring locations, as summarized in the following table.
As previously described, the frequency of effectiveness monitoring has varied since the program commenced, but was generally conducted at least quarterly, with the exception of the period from March 2011 through September 2013. In general, there was a decrease in TVPH concentrations observed across the Hartford Site between March 2011 and September 2013. This is believed to be attributed to historical low river stage conditions observed between August 2012 and January 2013 and again between August 2013 and February 2014, during which mass recovery rates via the SVE system were elevated compared to the previous three years and subsequent three years of operation (as shown on Figure 3-1). Following these historic low river stage conditions, TVPH concentrations have generally increased in the effectiveness monitoring locations. The Mississippi River stage has rebounded since February 2014, with a brief low observed between January and March 2015. Two of the highest river stages observed on record at the Mel Price Lock and Dam occurred in late December 2015 and early May 2017. Overall, the TVPH concentration trends can be subdivided into three general categories, described in the following subsections.
6.3.4.1. TVPH CONCENTRATIONS ARE STABLE
TVPH concentrations have remained stable since effectiveness monitoring began more than a decade ago at four of the nine locations evaluated including: nested multipurpose monitoring points MP-043A and MP-043B located in Effectiveness Zone 2 (Appendix H-2), nested vapor probes VMP- 066VS, VMP-066S, and VMP-066M located in Effectiveness Zone 2 (Appendix H-5), probe VMP-070M located in Effectiveness Zone 5 (Appendix H-6), and nested monitoring points MP-029A and MP- 029B located in Effectiveness Zone 6 (Appendix H-1).
- MP-029A (North Olive stratum) and MP-029B (Rand stratum) - TVPH concentrations have fluctuated significantly in these two multipurpose monitoring points, but continue to rebound to 1,000,000 ppmv periodically, as shown in Appendix H-1. These nested monitoring points are located on the western corner of East Birch Street, approximately 25 feet northwest of extraction well HSVE-099. Vapor recovery within Effectiveness Zone 6 has been limited due to occlusion of the extraction well screens with groundwater. Five additional SVE wells were connected to the SVE system within Effectiveness Zone 6 in June 2017 including wells HSVE-001D, HSVE-030S, HSVE-108, HSVE-110, and HSVE-111 (described further in Section 6.2.1.4). While these additional SVE wells were screened within the North Olive stratum, operation and mass recovery has remained limited due to continued occlusion of the well screens with groundwater, similar to other extraction wells located within Effectiveness Zone 6.
- MP-043A (North Olive stratum) and MP-043B (Main Silt stratum) - TVPH concentrations within these two multipurpose monitoring points have recently been measured as high as 140,000 ppmv in May 2017, corresponding with the historically high river stage (Appendix H-2). TVPH concentrations have fluctuated significantly over time within these two locations. These two nested multipurpose monitoring points are located in the center of Effectiveness Zone 2 on West Date Street.
- VMP-066VS (A-Clay), VMP-066S (North Olive stratum), and VMP-066M (Main Silt stratum) - As shown in Appendix H-5, TVPH concentrations have typically been measured between 1 and 100 ppmv since monitoring began, reflecting the location of these nested probes, which are approximately 40 feet beyond the limits of the LNAPL smear zone and dissolved phase hydrocarbons in Effectiveness Zone 2 (as shown in Appendix A).
- VMP-070M (Rand stratum) - TVPH concentrations have generally remained at 1,000,000 ppmv within this vapor probe since 2004, as shown in Appendix H-6. This nested probe is located in the alley between East Elm and Forest Streets and screened within the deeper portions of the Rand stratum. The shallower vapor monitoring probe within this nest, VMP-070S, is typically occluded with groundwater and soil vapor samples cannot be collected for screening TVPH concentrations. An SVE well was not installed in this portion of Effectiveness Zone 5 until May 2017. Extraction well HSVE-112, located approximately 50 feet to the southeast of probe VMP- 070M, began operating up in June 2017 (described further in Section 6.2.1.4).
6.3.4.2. TVPH CONCENTRATIONS ARE DECREASING SLOWLY
TVPH concentrations have decreased, albeit slowly at two nested monitoring locations including vapor probes VMP-094S and VMP-094VS located in Effectiveness Zone 5 (Appendix H-9) and multipurpose monitoring points MP-044A and MP-044B located in Effectiveness Zone 6 (Appendix H-3). At each of these locations, the maximum TVPH concentrations have decreased by at least a half an order of magnitude since effectiveness monitoring began; however, the concentrations have shown an increasing trend since September 2013.
6.3.4.3. TVPH CONCENTRATIONS HAVE DECREASED SIGNIFICANTLY
TVPH concentrations have decreased by several orders of magnitude at three of the nine monitoring locations that were evaluated including: nested probes VMP-027S and VMP-027M located in Effectiveness Zone 1 (Appendix H-4), nested probes VMP-073S and VMP-073M installed in Zone 3 (Appendix H-7), and nested probes VMP-081S and VMP-081M located in Effectiveness Zone 4 (Appendix H-8). At each of these locations, TVPH concentrations have generally been measured below 100 ppmv since effectiveness monitoring resumed in September 2013. TVPH concentrations are generally similar between the shallow and deeper probes at each of these locations.
6.3.5. SUMMARY OF EFFECTIVENESS MONITORING RESULTS
Based on the effectiveness monitoring results the following can be summarized for each of the SVE effectiveness zones:
- Zone 1 – While TVPH concentrations have decreased by 1 to 2 orders of magnitude in nested vapor monitoring probes VMP-027S and VMP-027M located on West Birch Street in the center of Effectiveness Zone 1 (Appendix H-4); overall the distribution of volatile petroleum hydrocarbons has changed very little over time with concentrations as high as 1,000,000 ppmv in the Rand stratum and more than 100,000 in the North Olive stratum during effectiveness monitoring performed in May 2017 (Appendix G-1-3 and Appendix G-2-3) and November 2017 (Appendix G-1-4 and Appendix G-2-4). Additional SVE wells were installed in Effectiveness Zone 1 in 2015 (HSVE-105S, HSVE-105D, HSVE-106S, HSVE-106D, HSVE-107S, and HSVE-107D) and 2017 (HSVE-104 and HSVE-113) and are anticipated to improve petroleum hydrocarbon mass recovery within the shallow strata.
- Zone 2 – Elevated TVPH concentrations are generally limited to the northern portion of Effectiveness Zone 2 where it abuts Effectiveness Zone 1 along West Cherry Street, as observed in November 2017 (Appendix G-1-4 and Appendix G-2-4); but can be observed in the central portions of Effectiveness Zone 2 during river stage triggered events, such as May 2017 (Appendix G-1-3 and Appendix G-2-3). The trends observed in nested monitoring points MP-043A and
- MP-043B, located on West Date Street (Appendix H-2) show the significant variability in the TVPH concentrations within the center of Effectiveness Zone 2.
- Zone 3 and 4 – Elevated TVPH concentrations are no longer observed within the North Olive or Rand strata (Appendix G-1-4 and Appendix G-2-4) beneath Effectiveness Zones 3 and 4, even during river stage triggered events (Appendix G-1-3 and Appendix G-2-3). TVPH concentrations have decreased and generally remain below 100 ppmv in the effectiveness monitoring locations installed in Effectiveness Zone 3 (Appendix H-7) and Zone 4 (Appendix H-8).
- Zone 5 – Elevated TVPH concentrations are currently observed within the Rand stratum across the majority of Effectiveness Zone 5 (Appendix G-2-3 and Appendix G-2-4). Whereas, elevated TVPH concentrations are limited to the northern half of Effectiveness Zone 5 within the North Olive stratum (Appendix G-1-4), and occasionally observed along the eastern portion of Effectiveness Zone 5 during river stage triggered events (Appendix G-1-3). Concentrations have remained around 1,000,000 ppmv in vapor probe VMP-070M, installed in the deepest portions of the Rand stratum (Appendix H-6) and have decreased slightly over time within vapor monitoring probes VMP-094VS and VMP-094S (Appendix H-9) installed in the shallower A-Clay and North Olive stratum. An additional SVE well was installed near probe VMP-070M in 2017 (HSVE-112) and it is anticipated to improve petroleum hydrocarbon mass recovery within the Rand stratum in this portion of Effectiveness Zone 5.
- Zone 6 – Elevated TVPH concentrations are currently observed within the Rand stratum across the majority of Effectiveness Zone 6 (Appendix G-2-3 and Appendix G-2-4). Whereas, elevated TVPH concentrations are limited to the northern and southern portions of Effectiveness Zone 6 within the North Olive stratum (Appendix G-1-3 and Appendix G-1-4). TVPH concentrations have been routinely measured at 1,000,000 ppmv within nested monitoring points MP-029A and MP-029B, screened in the North Olive and Rand stratum, respectively in the northern portion of Effectiveness Zone 6. TVPH concentrations have only decreased slightly over time in monitoring points MP-044A and MP-044B located in the southern limits of Zone 6, on West Date Street. The persistence of TVPH concentrations in Effectiveness Zone 6 is likely attributed to limited mass recovery via the SVE system within Effectiveness Zone 6, due the well screens in the extraction wells remaining consistently occluded with groundwater over time.
6.4. IN-HOME MONITORING
In-home screening began in May 2002, in response to odor complaints reported by residents to the Village of Hartford Fire Department, Illinois Environmental Protection Agency (Illinois EPA) and the Illinois Department of Public Health (Illinois DPH) following several weeks of “heavy precipitation”. Between 2002 and 2004, structures were typically monitored by the Illinois DPH and Illinois EPA following an odor complaint by the resident.
Beginning in 2004, in-home monitoring was performed by the Hartford Working Group to evaluate the vapor intrusion pathway. Monitoring was expanded and included routine (typically quarterly) collection of indoor air, sub-slab soil vapor, and sometimes outdoor air samples for laboratory analysis. In addition, interim measures were installed to mitigate the vapor intrusion pathway. Access was requested from more than 260 structures, with monitoring performed in more than half of these structures between 2004 and 2010.
Currently, in-home monitoring is performed on a weekly and quarterly basis to evaluate the vapor intrusion pathway and to determine if mitigation measures (including operation of the SVE system) are effective at preventing migration of volatile petroleum related constituents into structures. Additionally, more frequent monitoring is performed within select structures as part of a river stage triggered event.
Structures where in-home monitoring has been performed and mitigation measures have been installed since 2002 are identified on Figure 6-12. Additional description of the in-home monitoring program is described in the following subsections. A summary of the in-home monitoring results for the past five years, representing the current conditions beneath the Hartford Site, is provided in Section 6.4.5.
6.4.1. 2002 THROUGH 2004
The Illinois EPA and the Illinois DPH began investigating the vapor intrusion pathway for petroleum hydrocarbon vapors at the Hartford Site through direct monitoring within structures beginning in 2002, as well as targeted surveys and interviews in 2004. The Illinois DPH also engaged in consultation with the federal Agency for Toxic Substances and Disease Registry (ATSDR) regarding the risks to residents (Illinois Attorney General 2003).
The Illinois EPA, Village of Hartford Fire Department, and Premcor conducted in-home screening using a flame ionization detector and four-gas meter following several odor complaints reported by residents on East Watkins Street in May 2002. Initial TVPH concentrations in indoor air were reported between 10 and 11,000 ppmv. After this initial screening, several homes were ventilated, and the residents were provided temporary housing until further investigations could be performed to demonstrate that the concentrations of petroleum related constituents were safe for residents. Subsequently, indoor air samples were collected from four structures along the south side of East Watkins Street for laboratory analysis. By June 2002, the residents had returned to their homes on East Watkins Street after it was determined that the concentrations of petroleum related constituents within indoor air were at safe levels (Illinois DPH 2003).
Between June and August 2002, additional samples were collected to evaluate “background” conditions within select structures on East Watkins Street. Furthermore, on August 20, 2002, the Illinois DPH, along with the Illinois EPA, Madison County Health Department, and the Village of Hartford, went door-to-door to distribute a health questionnaire to approximately 550 structures in the Village of Hartford. Approximately, 110 questionnaires were returned to the Illinois DPH and on August 22, 2002, a public availability session was conducted to discuss the questionnaire results with concerned residents and stakeholders. Approximately 20 individuals attended the public availability session (Illinois DPH 2003).
Ultimately, the Illinois DPH concluded that while not always present, historical evidence suggests that the conditions (i.e., “weeks of heavy rain”) that caused the vapor intrusion pathway to be complete in May 2002 could return, and therefore petroleum hydrocarbons in the subsurface pose a public health concern for residents in the northern portions of the Village of Hartford. The Illinois DPH defined the chemicals of interest as benzene, toluene, hexane, and TVPH.
However, the Illinois DPH also reported that the Division of Epidemiologic Studies did not find evidence in the Illinois State Cancer Registry that an increased rate of leukemia, a cancer associated with benzene exposure, existed in the Village of Hartford. Lastly, the Illinois DPH determined that the existing SVE system was inadequate to prevent future risks to residents from the vapor intrusion pathway and recommended that the SVE system be evaluated and possibly expanded to reduce the potential for a completed pathway within structures (Illinois DPH 2003). As discussed in Section 6.2, the SVE system was expanded beginning in 2004.
The Illinois DPH and Illinois EPA conducted routine monitoring of homes between the second quarter 2003 and second quarter 2004, including collection of samples following odor complaints by residents.
6.4.2. 2004 THROUGH 2010
Routine in-home monitoring was conducted by the Hartford Working Group from 2004 to 2009 and consisted of screening indoor air and sub-slab soil vapor using a flame ionization detector and four- gas meter, as well as, the routine (typically quarterly) collection of indoor air, sub-slab soil vapor, and sometimes outdoor air samples for submittal to a laboratory for analysis of volatile constituents.
Additionally, beginning in 2004, a number of in-home mitigation activities were also performed by the Hartford Working Group including:
- Sealing cracks in basement walls and floors
- Installing a barrier to seal exposed soil surfaces within building footprints including crawlspaces (referred to as flowable fill)
- Sealing or fixing sewer drains within structures that could be a pathway for vapor migration
- Sealing openings where utilities enter structures
- Installing ventilation fans, carbon monoxide detectors, and combustible gas monitors in selected structures where a completed pathway was documented
- Installing air purifying systems in selected structures where a completed pathway was documented
- Installing sub-slab depressurization systems in selected structures where a completed pathway was documented
By March 2009, screening and sampling had been conducted within a total of 135 structures. Following March 2009, Apex assumed responsibility for the in-home monitoring program. It should be noted that between 2004 and 2009, the Hartford Working Group had discontinued monitoring within many structures due to: (1) the structure being located beyond the smear zone and dissolved phase limits, and/or (2) monitoring results reported below the site-specific screening levels over four quarterly monitoring events (ENSR-AECOM 2008).
6.4.2.1. COMPARISON VALUES
Within the Draft Plan for Interim Measures (dated January 28, 2005), the Hartford Working Group proposed that indoor air samples be analyzed for four compounds including benzene, ethylbenzene, toluene, and xylenes. The USEPA and Illinois EPA contacted the ATSDR and the Illinois DPH to review the Draft Effectiveness Monitoring Plan (ENSR et al. 2005). In response, the ATSDR reviewed the analytical results collected by the Illinois DPH and Illinois EPA between 2002 and 2004 and identified twelve petroleum related constituents that were routinely detected including 1,3-butadiene, benzene, butane, ethylbenzene, hexane, isopentane, methylcyclohexane, methyl tert-butyl ether, propylbenzene, toluene, total trimethylbenzenes, and total xylenes. The ATSDR recommended that the indoor air and sub-slab soil vapor samples be analyzed for these twelve constituents, referred to herein as constituents of concern and provided site-specific screening levels, which they referred to as comparison values. The sub-slab soil vapor comparison values were equivalent to the indoor air comparison values adjusted using a generic attenuation factor of 0.1, as recommended by the USEPA in the Draft Guidance for Evaluating the Vapor Intrusion to Indoor Air Pathway from Groundwater and Soils (USEPA 2002). The 0.1 attenuation factor reflected a conservative tenfold decrease in volatile petroleum hydrocarbon concentrations expected as soil vapor migrated into and mixed with indoor air within a structure.
Three constituents (ethylbenzene, methyl tert-butyl ether, and propylbenzene) were subsequently removed as constituents of concern between 2005 and 2006 because they were not detected above the comparison values during routine in-home monitoring by the Hartford Working Group. The minimum risk level for benzene was updated by the ATSDR in 2006. 1,3-butadiene was also eliminated as a constituent of concern in 2009 after it was determined that the presence of this constituent in indoor air was unrelated to migration from LNAPL and dissolved phase petroleum hydrocarbons beneath the Hartford Site. The constituents of concern and their respective comparison value (in unit of micrograms per cubic meter (µg/m3) used since 2009 are summarized in the following table.
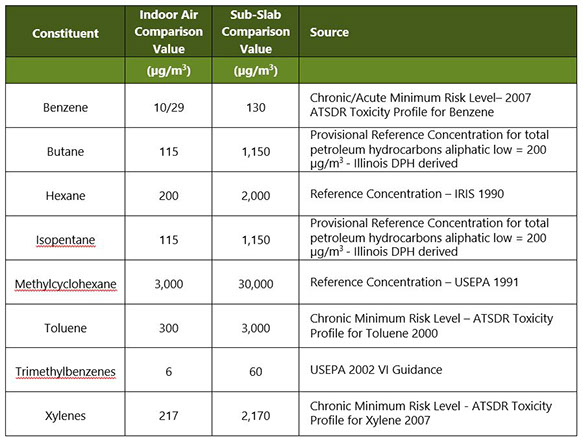
The comparison values reflect an acute inhalation risk for a residential receptor and are used to determine when further action is needed to ensure the safety of residents in a structure. When the concentration of a constituent of concern is detected above a comparison value, then a needs assessment evaluation and/or contingency measures (e.g., ventilation of the indoor air or crawlspace air, temporary relocation of residents in the structure, etc.) is conducted in accordance with the draft Hartford Working Group Contingency Plan (HWG 2004) and subsequent revisions (HWG 2007, HWG 2008).
While the comparison values are appropriate for evaluating acute exposure (as occurs during short duration river stage events), they do not reflect chronic risks for residential receptors. An evaluation of chronic risk has not been conducted at the Hartford site and has been identified as a data gap, as described in Section 7.0.
6.4.3. 2010 TO PRESENT
Beginning in May 2010, the in-home monitoring program was modified such that indoor air and sub-slab soil vapor samples were not collected for laboratory analysis unless the TVPH concentration measured using a flame ionization detector were above 10 ppmv in indoor air or 350 ppmv in sub- slab soil vapor. These concentration limits were referred to as action levels. In-home screening has been performed within 77 structures since May 2010. Indoor air and sub-slab soil vapor samples were collected from 28 structures over this timeframe due to TVPH concentrations being measured above the indoor air or sub-slab soil vapor action levels. The in-home monitoring results from the past five years are described in Section 6.4.5.
6.4.3.1. ACTION LEVELS
Triggers based on TVPH concentrations measured with a flame ionization detector were first used to determine when sub-slab and indoor air samples should be analyzed by the laboratory on an expedited turnaround time (ENSR-AECOM 2007). In 2009, AECOM proposed only collecting indoor air and sub-slab soil vapor samples if the TVPH screening results exceeded the following thresholds within residential structures:
- TVPH concentrations were measured above 500 ppmv in a sub-slab soil vapor probe; or
- TVPH concentrations were measured above 10 ppmv in indoor air and above 100 ppmv in soil vapor within any sub-slab probe.
These thresholds were developed based on review of historical indoor air and sub-slab TVPH screening results, the corresponding analytical results, and discussions with the regulatory Agencies. This field screening approach was first implemented in May 2010, while the sub-slab action level was subsequently revised to 350 ppmv, this approach continues to be conducted in accordance with the USEPA-approved final Interim In-Home Effectiveness Monitoring Plan (Trihydro 2014a).
An evaluation to determine if the action levels continue to be predictive of cases where comparison values may be exceeded within a residential structure was conducted using the indoor air analytical results and corresponding TVPH concentrations measured in indoor air for samples collected in 2016 and 2017. Indoor air samples were collected within 21 structures when the TVPH concentrations exceeded the action level of 350 ppmv in sub-slab soil vapor.
As shown on Figure 6-13, indoor air samples were collected for laboratory analysis when the TVPH concentrations in indoor air ranged between 0.0 ppmv and more than 150 ppmv. Data collected from one structure, 119 East Date Street, was excluded from this evaluation because in-home screening using a flame ionization detector was not performed within the 24-hour period during which the indoor air sample was collected for laboratory analysis. The evaluation presented on Figure 6-13 was focused on those constituents of concern that exceeded the indoor air comparison values in indoor air during 2016 and 2017, including hexane, butane, and isopentane and can be summarized as follows:
- Within 9 of the 20 structures, the TVPH concentrations in indoor air were measured below the indoor action level of 10 ppmv. In each of these 9 structures, the concentration of each of the constituents of concern were reported below their respective comparison value.
- Within 11 of the 20 structures, the TVPH concentrations in indoor were measured above the indoor action level of 10 ppmv. Within 9 of these structures, at least one of the constituents of concern (hexane, butane, and/or isopentane) were reported above the comparison values.
Based on the data collected in 2016 and 2017, the sub-slab soil vapor and indoor air action levels continue to be predictive of cases where comparison values may be exceeded within indoor air and in some cases, the action levels may be overly conservative. These results support the continued use of field screening and corresponding TVPH action levels of 10 ppmv for indoor air and 350 ppmv for sub-slab soil vapor to determine in which structures the vapor intrusion pathway may be complete, and where additional samples should be collected for laboratory analysis. Figure 6-14 presents the current decision flowchart for evaluating the vapor intrusion pathway at the Hartford Site.
6.4.4. RIVER STAGE TRIGGERED MONITORING
It was first noted in 1973 that a relationship existed between the number of odor complaints received by the Hartford Fire Department and a rise in the river stage. In correspondence from Amoco to the Illinois State Fire Marshall dated March 13, 1973, it was noted that "all (odor) complaints have followed heavy rains and a rise in river level, which would tend to flood sewers and raise the water table" (Engineering-Science 1992). It was subsequently identified that more than 70% of the reported vapor intrusion related complaints over the past 40 years occurred when the Mississippi River stage increased at a rate of two or more feet per day, when the river elevation was already above 410 ft-amsl (ENSR-AECOM 2008). These hydraulic conditions are present over short intervals (generally less than one week) during infrequent events (often less than three events each year) typically occurring between March and June (Trihydro 2014a).
Based on these observations, river stage triggers for in-home monitoring were first considered in 2006. Time-series analyses indicated that elevated river stage was the primary indicator for a completed pathway into structures and precipitation had less of a clearly defined correlation with vapor intrusion events (ENSR-AECOM 2006). As such, a river stage trigger was subsequently defined (ENSR-AECOM-2007) as:
- The Mississippi River elevation as measured at the Mel Price Lock and Dam exceeded 415 ft-amsl (corresponding to a stage of 19.5 feet). A subsequent event could not be triggered for two weeks thereafter and only if the Mississippi River elevation decreased below 415 ft-amsl and then increased again above this threshold.
- A second threshold was established at an elevation of 420 ft-amsl (corresponding to a Mississippi River stage of 24.5 feet as measured at the Mel Price Lock and Dam). A subsequent event could not be triggered for two weeks thereafter and only if the Mississippi River elevation decreased below 420 ft-amsl and then increased again above this threshold.
The river stage trigger was subsequently revised in 2009 and defined as an increase in the Mississippi River stage to 14.5 feet (410 feet above mean sea level) as measured at the Mel Price (a.k.a., Alton) Lock and Dam, followed by an additional 2-foot rise over a 24-hour period (AECOM Environment 2009). Once an event is triggered, another event could not be triggered until at least one week later, if there was a subsequent two-foot rise in the river over a 24-hour period. The revised trigger is currently used for determining when a river stage monitoring event has occurred.
The Mississippi River stage at Mel Price Lock and Dam is tracked using the Advanced Hydrologic Prediction Service from the National Weather Service. The Advanced Hydrologic Prediction Service identifies a 14-day forecast projection for the tailwater depth which is used to forecast a potential event. Once an event has been triggered, monitoring has typically been performed every other day within selected structures for a period of seven days. Additional monitoring has been performed in structures if the TVPH concentrations within the indoor air and sub-slab soil vapor were measured above the action levels. Routine monitoring was typically discontinued after indoor air and sub-slab soil vapor concentrations were measured below the action levels during subsequent in-home screening events.
Since the inception of river stage triggered monitoring, 43 events have occurred. A graphical summary of the river stage triggered events, including a summary of the monitoring results and conditions observed prior to and during each event, is provided on Figures 6-10 and 6-11. As described in the subsequent section, more than 70% of the time, a completed vapor intrusion pathway was first identified in a structure during a river stage triggered monitoring event over the past five years.
6.4.5. IN-HOME MONITORING RESULTS, 2013-2017
There were 77 structures where in-home monitoring was performed at least once between 2013 and 2017. TVPH concentrations were measured below the indoor air and sub-slab soil vapor action levels within 46 of these structures. The results for the remaining 31 structures can be grouped into the following three behavior types:
- Structures where TVPH concentrations were only observed above the action level in indoor air
- Structures where TVPH concentrations were only observed above the action level within sub-slab soil vapor
- Structures where TVPH concentrations were measured above the action levels in indoor air and sub-slab soil vapor
As described in Section 6.4.3.1 and shown on Figure 6-14, if the TVPH concentrations were measured above the actions levels within indoor air (10 ppmv) or sub-slab soil vapor (350 ppmv), then an indoor air and soil vapor sample were collected for laboratory analysis, unless the TVPH concentrations were attributed to an alternate source within the structure (e.g., natural gas leak). An indoor air and soil vapor sample were not recollected from a structure if: (1) samples were collected in the proceeding months, and (2) there was not a significant change in the TVPH concentrations within soil vapor and indoor air. In one instance (125 West Birch Street Rear in May 2017), indoor air and sub-slab soil vapor samples were not collected as the TVPH concentrations increased above the action levels and then decreased below the action levels over a very short timeframe.
The indoor air and sub-slab soil vapor samples were analyzed for the volatile petroleum related constituents of concern. The analytical results for samples collected since 2013 are summarized in Table 6-2 and include a comparison to the comparison values. The vapor intrusion pathway was considered complete, and typically required mitigation to be performed within a structure, when concentrations of a constituent of concern was reported above the comparison value in both sub- slab soil vapor and indoor air. In some cases, mitigation measures may have been installed previously and were used to reduce the concentration of volatile constituents within the structure. In other cases, mitigation measures were installed and operated to reduce the concentration of petroleum related constituents within indoor air and/or sub-slab soil vapor, with the goal of rendering the vapor intrusion pathway incomplete.
A summary of the in-home screening results for the 31 structures where TVPH concentrations were measured above the indoor air and/or sub-slab soil vapor action level is provided in the remainder of this section. This summary is organized by the three behavior types and includes a discussion of the analytical results for structures where samples were collected, as well as mitigation measures used to eliminate the vapor intrusion pathway, when necessary. It should be noted that a structure might have exhibited more than one of the three behavior types over the past five years of monitoring (e.g., 101 East Birch Street) and therefore listed more than once under the three subsections that follow.
6.4.5.1. TVPH CONCENTRATIONS ONLY ABOVE INDOOR AIR ACTION LEVEL
There were 12 structures in which TVPH concentrations were measured above the action level within indoor air but not within sub-slab soil vapor over the past five years. In each of these cases an alternate source was identified within the structure and the vapor intrusion pathway was determined to be incomplete. The following provides a summary of the results from each of these structures:
- 111 West Date Street – On April 25 and May 3, 2013, during river stage triggered event EBMP-17, TVPH concentrations were measured above the indoor air action level in the basement and first floor. TVPH concentrations were not measured above the sub-slab soil vapor action level in any of the sub-slab probes during this river stage triggered event and it was determined that volatile constituents present within indoor air were attributed to the drain in the basement.
- 115 West Cherry Street – On May 25, 2017, in-home screening was performed after determining that a completed vapor intrusion pathway was present within the adjacent structure, 113 West
Cherry Street (described in Section 6.4.5.3). During screening, a strong natural gas odor was noted in the first floor and basement. In response, Apex contracted with AAA Heating, Cooling and Refrigeration on June 1, 2017 to perform leak testing to evaluate the integrity of the natural gas transmission system within the structure. In addition, Apex arranged to install sub-slab soil vapor probes concurrently with leak testing. Leak testing demonstrated that the natural gas transmission system within the structure was corroded in multiple locations resulting in elevated TVPH concentrations within the basement and first floor. It was determined that sub-slab probes could not be installed safely at that time. The homeowner was verbally informed of the compromised natural gas transmission piping on June 1, 2017 and via correspondence dated June 20, 2017 (212 Environmental 2018).
- 117 West Birch Street – On May 5, 2015, and again on February 22, March 8, and April 19, 2017, during weekly in-home screening, TVPH concentrations were measured above the indoor air action level in the basement and basement drain; however, TVPH concentrations were not measured above the sub-slab soil vapor action levels, or the indoor air action levels in the basement during any of the other weekly monitoring events or river stage triggered events. A strong sewer like odor was noted in the basement at 117 West Birch Street during these weekly events. In May 2017, routine in-home screening was discontinued in this structure following recommendations from the Village of Hartford Police Department (212 Environmental 2018).
- 118 West Birch Street – On April 26, 2013 (during river stage triggered event EBMP-17) and again on June 5, 2013 (during river stage triggered event EBMP-18), TVPH concentrations were measured above the indoor air action level in the basement. TVPH concentrations were not measured above the sub-slab soil vapor action level in any of the sub-slab probes during these two river stage triggered events and it was determined that volatile constituents present within indoor air were attributed to the drain in the basement.
- 122 West Watkins Street – On April 16, 2013, during river stage triggered event EBMP-16, TVPH concentrations were measured above the indoor air action level in the living room on the first floor. TVPH concentrations were not measured above the sub-slab soil vapor action level in any of the sub-slab probes during this river stage triggered event and it was determined that volatile constituents present within indoor air were attributed to an alternate source within the structure.
- 125 West Birch Street Rear – On November 11, 2016 and again on May 4, 2017 (during river stage triggered event EBMP-34), TVPH concentrations were measured above the indoor action level in the basement. It was determined that the basement drain was the source of the volatile constituents measured in indoor air within 125 West Birch Street Rear. A Dranjer™ seal was installed in the basement drain on May 4, 2017 and TVPH concentrations were measured below the indoor air action levels two days later. It should be noted that this structure was and remains vacant (212 Environmental 2018).
- 401 North Olive Avenue – On April 9, 2017 during river stage triggered event EBMP-33, TVPH concentrations were measured above the indoor air action level in the basement but not the first floor at 401 North Olive Avenue. TVPH concentrations were measured below the soil vapor action level within the sub-slab probes. The owner of the property reported that there was a significant backup within the sewer system that was in the process of being repaired both within and outside the structure. A significant sewage-like odor was present in the basement. TVPH concentrations were not reported above the indoor air action level in the basement thereafter. It should be noted that this structure was vacant at the time that TVPH concentrations were measured above the indoor air action level within the unfinished basement (212 Environmental 2018).
- 504 North Delmar Avenue – On July 17, 2013 and again during six weekly screening events between June and October 2017, TVPH concentrations were reported above the indoor air action level in the basement. TVPH concentrations were measured below the soil vapor action level within the sub-slab probes over the same timeframe. A natural gas-like odor was noted frequently during in-home monitoring and was reported to the owner of the structure. The owner subsequently identified a leak in the natural gas transmission line behind the stove within the first-floor apartment. This leak was repaired in early-November 2017 and TVPH concentrations have remained below the indoor air action level (212 Environmental 2018).
- 507 North Olive Avenue – TVPH concentrations were measured above the indoor air action level in the basement and/or first floor on March 1, May 23, May 25, and October 4, 2017. TVPH concentrations were measured below the soil vapor action level within each of the seven sub- slab probes installed in 507 North Olive Avenue on each of these weekly monitoring events. During each of these events, the recent use of air fresheners to mask cigarette smoke was noted and it is believed that TVPH concentrations measured in indoor air were attributed to alternate sources within the structure.
- 610 North Old St. Louis Road – On July 17, 2013, TVPH concentrations were reported above the indoor air action level in the entrance and basement. TVPH concentrations were measured below the soil vapor action level within the sub-slab probes during this weekly monitoring event and it was determined that volatile constituents present within indoor air were attributed to the sump located in the basement.
- 619 North Olive Avenue – In March, April, May, and June 2013, during and immediately following river stage triggered events EBMP-15 through EBMP-18, TVPH concentrations were reported above the indoor air action level in the basement. TVPH concentrations were not measured above the soil vapor action level in any of the sub-slab probes during these river stage triggered events and it was determined that volatile constituents present within indoor air were attributed to the drain in the basement.
- 715 North Delmar Avenue – On March 15 and June 3, 2013 during river stage triggered events EBMP-15 and EBMP-18, TVPH concentrations were reported above the indoor air action level in the basement and other portions of the Hartford Community Center including the gymnasium. TVPH concentrations were not measured above the sub-slab soil vapor action level in any of the sub-slab probes during these two river stage triggered events and it was determined that volatile constituents present within indoor air were attributed to the drains in the basement or another alternate source in the Community Center.
6.4.5.2. TVPH CONCENTRATIONS ONLY ABOVE SOIL VAPOR ACTION LEVEL
There were 11 structures in which TVPH concentrations were measured above the soil vapor action level in the sub-slab probes, but concentrations remained below the indoor air action levels. In the majority of these cases it was determined that while there may have been a source beneath the structure, concentrations of the vapor constituents of concern remained below the Comparison Values and the vapor intrusion pathway was considered incomplete with the exception of 119 West Date Street, 125 West Birch Street, and 516 North Delmar Avenue. The following provides a summary of the results from each of these structures:
- 101 East Birch Street – TVPH concentrations in at least one of the sub-slab probes were measured above the soil vapor action level on February 14, 2017 during quarterly monitoring, and again on May 3, May 25, and May 27, 2017 during river stage triggered events EBMP-34 and EBMP-35. Indoor air and sub-slab soil vapor samples were collected and submitted for laboratory analysis in February 2017. The analytical results indicated that concentrations of the constituents of concern were below the comparison values in indoor air and sub-slab soil vapor and therefore no further action was recommended (212 Environmental 2017b). It should be noted that this structure was vacant during this timeframe and was subsequently demolished in July 2017.
- 106 West Birch Street – TVPH concentrations were measured above the soil vapor action level in sub-slab probe SS-2 between February and July 2017. Indoor air and sub-slab soil vapor samples were collected and submitted for laboratory analysis in February 2017. The analytical results indicated that concentrations of butane and isopentane were greater than their respective comparison value in sub-slab soil vapor; however, each of the constituents of concern (including butane and isopentane) were reported below the comparison values within indoor air. Based on the analytical results, it was determined that the vapor intrusion pathway was incomplete within 106 West Birch Street and no further action was recommended (212 Environmental 2017b). It should be noted that this structure was vacant throughout this timeframe, until it was demolished in August 2017.
- 117 West Birch Street – TVPH concentrations were measured above the soil vapor action level in sub-slab probe SS-1 on March 16, 2013 (during river stage triggered event EBMP-15) and again between February 24 and 26, 2014. Sub-slab and indoor air samples were collected on March 16, 2013, March 27, 2013, and February 24, 2014. The analytical results for the samples collected on March 16, 2013 indicated that concentrations of butane, hexane, and isopentane were greater than their respective comparison value in sub-slab soil vapor; however, each of the constituents of concern (including butane, hexane, and isopentane) were reported below the comparison values within indoor air. The analytical results for samples collected on March 27, 2013 and February 24, 2014 indicated that none of the constituents of concern were measured above their respective comparison value in sub-slab soil vapor or indoor air. Based on the analytical results collected between 2013 and 2014, it was determined that the vapor intrusion pathway was incomplete within 117 West Birch Street and no further action was recommended.
- 119 East Date Street – In-home screening was performed weekly within 119 East Date Street after TVPH concentrations were measured above the sub-slab soil vapor action level within 507 North Olive Avenue. TVPH concentrations were measured above the soil vapor action level in at least one of the sub-slab probes within 119 East Date Street during weekly monitoring performed between December 12, 2016 and January 11, 2017; and again, between February 1 and 15, 2017. Indoor air and sub-slab soil vapor samples were collected and submitted for laboratory analysis in December 2016. The analytical results indicated that concentrations of butane, hexane, and isopentane were greater than their respective comparison value in sub-slab soil vapor; and isopentane was measured above the comparison values within indoor air (212 Environmental 2017b). Mitigation measures were not installed within this structure as it was vacant between December 2016 and February 2017. This structure was subsequently demolished in September 2017.
- 119 West Cherry Street – TVPH concentrations were measured above the soil vapor action level in the three sub-slab probes on April 24, 2013, during river stage triggered event EBMP-17. Indoor air and sub-slab soil vapor samples were collected within 119 West Cherry Street that same day. The concentration of butane, hexane, and isopentane were greater than the comparison values in sub-slab soil vapor; however, each of the constituents of concern (including butane, hexane, and isopentane) were reported below the comparison values within indoor air. Based on the analytical results, it was determined that the vapor intrusion pathway was incomplete within 119 West Cherry Street and no further action was recommended.
- 119 West Date Street – TVPH concentration were measured above the soil vapor action level in the three sub-slab probes between April 23 and 29, 2013, during river stage triggered event EBMP-17. Indoor air and sub-slab soil vapor samples were collected within 119 West Date Street on April 23, 2013. The concentration of butane and isopentane were greater than the comparison values in sub-slab soil vapor; however, each of the constituents of concern (including butane and isopentane) were reported below the comparison values within indoor air. Based on the analytical results, it was determined that the vapor intrusion pathway was incomplete within 119 West Date Street and no further action was recommended.
- 125 West Birch Street – TVPH concentrations were measured above the soil vapor action level in sub-slab probe SS-1 between March 20 and 22, 2013 following river stage triggered event EBMP-15. Indoor air and sub-slab soil vapor samples were collected that same day. The concentration of benzene, butane, and isopentane were greater than the comparison values in sub-slab soil vapor; and isopentane was also reported above the comparison value within the indoor air sample collected within the unfinished basement. Mitigation measures were performed within and outside the structure on March 20 and 21, 2013, including supplemental vapor recovery from multipurpose monitoring points MP-078B and MP-078C, as well as replacement of the Dranjer™ seals in the two floor drains located in the basement. On March 22, 2013, the TVPH concentrations in sub-slab probe SS-1 had decreased below the soil vapor action level. A confirmation soil vapor and indoor air sample collected for laboratory analysis on March 28, 2013 showed that concentrations of the constituents of concern were below the comparison values beneath and within 125 West Birch Street (Gannett Fleming 2013b).
TVPH concentrations were again measured above the soil vapor action level in sub-slab probe SS-1 on April 8 and 9, 2014, during river stage triggered event EBMP-19. Indoor air and sub-slab soil vapor samples were collected on April 9, 2014. The concentration of butane was measured above than the comparison value in sub-slab soil vapor; however, each of the constituents of concern (including butane) were reported below the comparison values within indoor air. Based on the analytical results, it was determined that the vapor intrusion pathway was incomplete within 125 West Cherry Street during river stage triggered event EBMP-19.
On May 4, 2017, the TVPH concentration measured in sub-slab probe SS-3 was reported at 466 ppmv (greater than the soil vapor action level) during river stage triggered event EBMP-34. Two days later the TVPH concentration in this same probe was measured at 15.4 ppmv. The TVPH concentrations within indoor air remained below the indoor air action level throughout the river stage triggered event. Indoor air and sub-slab soil vapor samples were not collected from this structure during river stage triggered event EBMP-34 as the TVPH concentrations beneath the structure decreased rapidly as the Mississippi River receded following a historically high river stage (212 Environmental 2018).
- 125 West Birch Street Rear – TVPH concentration were measured above the soil vapor action level in sub-slab probe SS-2 on April 20 and 21, 2013, shortly following river stage triggered event EBMP-15. Indoor air and sub-slab soil vapor samples were collected within 125 West Chery Street on April 20, 2013. The concentration of benzene, butane, and isopentane were greater than the comparison values in sub-slab soil vapor; however, each of the constituents of concern (including benzene, butane, and isopentane) were reported below the comparison values within indoor air. An additional soil vapor and indoor air sample collected for laboratory analysis on March 28, 2013 showed that concentrations of the constituents of concern were below the comparison values beneath and within 125 West Birch Street Rear. Based on the analytical results, it was determined that the vapor intrusion pathway was not complete within this structure following river staged triggered event EBMP-15.
- 126 East Elm Street – The TVPH concentration measured in sub-slab probe SS-3 was reported above the soil vapor action level on May 4, 2017 during river stage triggered event EBMP-34. Indoor air and sub-slab soil vapor samples were collected on May 10 and 11, 2017 from 126 East Elm Street. The analytical results indicate that concentrations of isopentane were greater than the comparison value in sub-slab soil vapor; however, each of the constituents of concern (including isopentane) were reported below the comparison values within indoor air. Based on the analytical results, it was determined that the vapor intrusion pathway was incomplete within 126 East Elm Street and no further action was recommended (212 Environmental 2018).
- 507 North Olive Avenue – TVPH concentrations were measured above the soil vapor action level routinely between December 7, 2016 and July 12, 2017. TVPH concentrations have been measured above the soil vapor action levels periodically since in-home screening began in this structure in April 2005. In response to routine elevated TVPH concentrations observed beneath this structure, an indoor air and sub-slab soil vapor sample were collected and submitted for laboratory analysis from 507 North Olive Avenue between December 14 and 15, 2016. The analytical results indicated that concentrations of butane, hexane, and isopentane were measured above the sub-slab soil vapor comparison values. However, none of the constituents of concern (including butane, hexane, and isopentane) were reported above the comparison values within the indoor air sample collected from this structure. The laboratory analytical results indicated that the vapor intrusion pathway was incomplete within this structure (212 Environmental 2017b).
The consistent detection of TVPH concentrations beneath 507 North Olive Avenue was attributed to operation of the sub-slab depressurization system installed in 2005. The suction pits for the sub-slab depressurization system are located adjacent to those sub-slab probes where higher TVPH concentrations have been measured since December 2016. In response to elevated TVPH concentrations measured in the soil vapor near and beneath this structure, extraction well HSVE- 109 was installed in June 2017 and commenced operation on June 27, 2017. Operation of well HSVE-109 has resulted in significant reductions in the TVPH concentrations beneath this structure (212 Environmental 2018). The sub-slab depressurization system within 507 North Olive Avenue was subsequently shut down on December 6, 2017.
- 516 North Delmar Avenue – TVPH concentrations were measured above the soil vapor action level in sub-slab probe SS-3 on March 18, 2013 (during river stage triggered event EBMP-15) and again between April 7 and 8, 2014 (during river stage triggered event EBMP-19). Sub-slab and indoor air samples were collected on March 18, 2013 and April 8, 2014. The analytical results for the samples collected on March 18, 2013 indicated that none of the constituents of concern were measured above their respective comparison value in sub-slab soil vapor or indoor air. The analytical results for samples collected on April 8, 2014 indicated that butane, hexane, and isopentane were greater than the comparison values in sub-slab soil vapor. Butane and isopentane were also reported above the comparison values within indoor air. In response to the completed vapor intrusion pathway into 516 North Delmar Avenue during river stage triggered event EBMP-19, an evaluation of operation of nearby vapor extraction well HSVE-004R was performed. It was determined that the Hartford Working Group (who had recently assumed operation of the SVE system from Apex) had not adjusted the Viton stinger and the well screen had become occluded. The stinger was adjusted within vapor extraction well HSVE-004R on April 8, 2014 and TVPH concentrations decreased below the soil vapor action level within each of the sub-slab probes installed in 516 North Delmar Avenue by the following day.
6.4.5.3. TVPH CONCENTRATIONS ABOVE INDOOR AIR AND SOIL VAPOR ACTION LEVELS
TVPH concentrations were measured above the indoor air and soil vapor action levels within 13 structures over the past five years. The vapor intrusion pathway was determined to be complete at all of these structures with two exceptions (122 East Date Street and 309 North Olive Avenue). The following provides a summary of the in-home screening results from each of these structures:
- 101 East Birch Street – TVPH concentrations within indoor air and sub-slab soil vapor were measured above the action levels on August 26, 2015, during quarterly monitoring. The USEPA and Illinois EPA were notified via email that day and it was determined that additional monitoring including the collection of samples for laboratory analysis was not necessary since the structure was vacant. Extraction well HSVE-099, located adjacent to this structure in Effectiveness Zone 6, was temporarily shut-down during high water table conditions and the elevated concentrations measured beneath the slab and inside 101 East Birch Street were recorded following a rapid decrease in the Mississippi River stage and groundwater elevations. Extraction well HSVE-099 was restarted on August 26, 2015. The sub-slab and indoor air concentrations were subsequently measured below the action levels within and below the structure on August 27, 2015 (Trihydro 2015d). As discussed in the Section 6.4.5.2, this structure was demolished in July 2017.
- 105 West Cherry Street – TVPH concentrations were measured above the sub-slab soil vapor action level in at least one of the sub-slab probes installed in 105 West Cherry Street between: (1) February 18 and March 13, 2017, (2) April 5 and 9, 2017 (during river stage triggered event EBMP-33), and (3) May 1 and 5, 2017 (during river stage triggered event EBMP-34). TVPH concentrations were also measured above the indoor air action level within this structure between February 18 and 22, 2017, and again on March 7, 2017. Indoor air and sub-slab soil vapor samples were collected and submitted for laboratory analysis on February 23, 2017. The analytical results indicated that concentrations of butane, hexane, isopentane, and methylcyclohexane were measured above the sub-slab soil vapor comparison values and hexane was also reported within indoor air above the comparison value (212 Environmental 2017b).
While this structure was vacant, Apex elected to conduct a low-flow air injection pilot test to mitigate the vapor intrusion pathway. This technique involves the introduction of ambient air beneath the building using a low-flow fan connected to small diameter ports installed across the building slab. This low-flow air injection technique increases oxygen concentrations directly beneath the building slab, which enhances aerobic biodegradation rates. The rate of air injection was adjusted until advective gradients were not measured across the building slab (or in other words until a pressure was not measured within the sub-slab probes). The low-flow air injection pilot test was conducted at 105 West Cherry Street beginning on March 15, 2017. The outcomes of the pilot test indicated that the oxygen concentrations beneath the slab increased while the TVPH concentrations decreased to below the soil vapor action levels (212 Environmental 2017b). The low-flow air injection system was subsequently shut down on July 24, 2017, following installation and startup of vapor extraction well HSVE-113. TVPH concentrations remained below the soil vapor and indoor air action levels within this vacant structure following shutdown of the low-flow air injection pilot system. The low-flow air injection system remains in place and may be operated if necessary in the future (212 Environmental 2018).
- 107 West Birch Street – TVPH concentrations were measured above the soil vapor action level in sub-slab probes SS-1 and SS-2 on March 15, 2013 during river stage triggered event EBMP-15. TVPH concentrations were also measured above the indoor air action level within 107 West Birch Street on March 15 and 18, 2013. Indoor air and sub-slab soil vapor samples were collected within the structure on March 15, 2013. The concentration of butane, hexane, and isopentane were greater than the comparison values in sub-slab soil vapor. Butane and isopentane were also reported above the comparison values within the indoor air sample collected within the basement and first floor. Mitigation measures were performed within and outside the structure on March 15, 2013, including supplemental vapor recovery from multipurpose monitoring point MP-079B, as well as sealing the basement floor drain with a Dranjer™ seal. Additional monitoring could not be conducted in this structure over the next two days as the homeowner was out of town. On March 18, 2013, the TVPH concentrations in the sub-slab probes had decreased below the soil vapor action level. A confirmation soil vapor and indoor air sample collected for laboratory analysis on March 27, 2013 showed that concentrations of the constituents of concern were below the comparison values beneath and within 107 West Birch Street (Gannett Fleming 2013a). Three additional nested SVE wells were installed in Effectiveness Zone 1 in December 2014 and connected to the SVE system by February 2015 (Trihydro 2015a) to address the completed vapor intrusion pathway observed in this and several other structures on West Birch Street during river stage triggered events that occurred in 2013 and 2014.
- 107 West Cherry Street – TVPH concentrations were measured above the sub-slab soil vapor action level in at least one of the sub-slab probes installed in 107 West Cherry Street between February 18 and May 10, 2017 (including river stage triggered events EBMP-33 and EBMP-34). TVPH concentrations were also measured above the indoor air action level within this structure periodically over this same timeframe. Indoor air and sub-slab soil vapor samples were collected and submitted for laboratory analysis on February 23, 2017 (the same day TVPH concentration were first measured above the action level in indoor air). The analytical results indicated that concentrations of butane, hexane, and isopentane were greater than their respective comparison value in sub-slab soil vapor; while butane was reported above the comparison value within indoor air (212 Environmental 2017b). In response, a ventilation system was installed in the basement of 107 West Cherry Street on March 9, 2017. The ventilation system works by creating a negative vacuum in one portion of the basement while makeup air is introduced through a fresh air intake within another portion of the basement. The ventilation system was operated continuously until June 15, 2017 and then operated on a cyclical basis each day until September 12, 2017, when the ventilation fan was shut off (212 Environmental 2018).
In addition, a low-flow air injection system was also installed in the basement (based on the results of the pilot test performed at 105 West Cherry Street) on May 10, 2017. Following installation of the low-flow air injection system, sub-slab soil vapor concentrations decreased below the action level and oxygen levels increased beneath the structure. The low-flow air injection system was subsequently shut down on August 21, 2017, following installation and startup of vapor extraction well HSVE-113 and termination of the pilot system in 105 West Cherry Street. The ventilation and low-flow air injection systems remain in place and may be operated if necessary in the future (212 Environmental 2018).
TVPH concentrations in the first floor and basement continued to be periodically measured above the indoor action level following installation of the ventilation and low-flow air injection systems. On September 12, 2017, a natural gas leak was identified during routine screening within the structure. The homeowner subsequently applied pipe sealant where the leaks were identified. While TVPH concentrations initially increased within indoor air (possibly a result of application of the petroleum-based pipe sealant), the concentrations subsequently decreased to below the indoor air action levels (212 Environmental 2018).
- 111 West Cherry Street – TVPH concentrations within soil vapor were measured above the action levels between April 8 and 26, 2017 (during and following river stage triggered event EBMP-33) and again between May 3 and 9, 2017 (during river stage triggered event EBMP-34). TVPH concentrations were also measured above the indoor air action level within this structure periodically over this same timeframe. An indoor air and sub-slab soil vapor sample were collected for laboratory analysis on April 9 and 10, 2017. Butane and isopentane were measured above the indoor air comparison values, while butane, hexane, and isopentane were measured in the sub-slab sample above the soil vapor comparison values. In response to the completed vapor intrusion pathway, a low-flow air injection system was installed in the basement of 111 West Cherry Street (based on the results of the pilot test performed at 105 West Cherry Street) on April 26, 2017. As part of installation of the low-flow air injection system, cracks and large openings within the concrete walls and slab were sealed. A Dranjer™ seal was also installed in the floor drain. Following installation of the low-flow air injection system, sub-slab soil vapor concentrations decreased below the action level and oxygen levels increased beneath the structure until May 1, 2017 (following the start of river stage triggered event EBMP-34). The low- flow air injection system was expanded that same day to allow for injection of atmospheric air across a larger portion of the building slab. TVPH concentrations decreased in sub-slab soil vapor and indoor following expansion of the air injection system and have remained below the action levels since May 10, 2017. A confirmation indoor air sample was collected in the basement of this structure on May 12, 2007. The concentration of constituents of concern were all reported below the comparison values within the indoor air sample (212 Environmental 2018).
A ventilation system was also installed in 111 West Cherry Street between June 8 and 9, 2017. The ventilation system was operated intermittently and eventually turned off on June 23, 2017, as TVPH concentrations remained below the indoor air action level throughout the structure. The low-flow air injection system was subsequently shut down on September 11, 2017, following installation and startup of vapor extraction well HSVE-113 and termination of the pilot system in 105 West Cherry Street. The ventilation and low-flow air injection systems remain in place and may be operated if necessary in the future (212 Environmental 2018).
- 113 West Cherry Street – TVPH concentrations within soil vapor were measured above the action level between May 2 and November 1, 2017. TVPH concentrations were also periodically measured above the action level in indoor air between May 2 and August 1, 2017. An indoor air and sub-slab soil vapor sample were collected for laboratory analysis on May 3 and May 8, 2017, respectively. Butane and isopentane were measured above the indoor air comparison values, while butane, hexane, isopentane, and methylcyclohexane were measured in the soil vapor sample above the sub-slab comparison values. The floor and walls within the basement of this structure had been previously sealed in 2004 and subsequently maintained by the homeowner. However, a 6-inch floor drain had not been sealed. On May 15, 2017, a Dranjer™ seal was installed within the floor drain. Additionally, between June 8 and 9, 2017, a ventilation system was installed in the basement at 113 West Cherry Street. Shortly following installation, the homeowner began cycling the system on during the evening hours and off during the daytime (212 Environmental 2018).
It should be noted that a leak within the natural gas transmission system was identified in this structure and discussed with the homeowner during the first screening event performed on April 10, 2017. On August 1, 2017, the natural gas transmission system was replaced. Subsequently, TVPH concentrations within indoor air were measured below the indoor air action levels during routine monitoring. The ventilation system has remained off since the natural gas transmission system was replaced (212 Environmental 2018). TVPH concentrations decreased below the soil vapor action level in each of the sub-slab probes installed in 113 West Cherry Street by early-July 2017, in response to sustained operation of vapor extraction well HSVE-113.
- 119 West Birch Street – On May 4, 2017, during river stage triggered event EBMP-34, TVPH concentrations were measured above the indoor action level in the basement and first floor. The TVPH concentrations in soil vapor could not be measured as water was present within each of the sub-slab probes installed in the basement. Indoor air samples were collected from the basement and first floor of this structure that same day and submitted for laboratory analysis. The analytical results indicated that concentrations of butane and isopentane in the first-floor sample were above their respective indoor air comparison values. A ventilation fan had been previously installed within 119 West Birch Street and was immediately turned on during screening on May 4, 2017. The TVPH concentrations were measured below the action levels in the basement and first floor the next day (212 Environmental 2018). The ventilation fan was shut off in this structure the following week once the river stage receded and it was shown that TVPH concentrations remained below the indoor air action level.
- 122 East Date Street – TVPH concentrations were measured above the soil vapor action level between May 2 and 9, 2017 during and immediately following river stage triggered event EBMP-34. The TVPH concentrations exceeded the indoor air action level on May 6, 2017. An indoor air and sub-slab soil vapor sample were collected on May 10 and 11, 2017 from 122 East Date Street. The analytical results indicated that concentrations of butane, hexane, isopentane, and methylcyclohexane were measured above the sub-slab soil vapor comparison values; however, each of the constituents of concern (including butane, hexane, isopentane, and methylcyclohexane) were reported below the comparison values within indoor air. Based on the analytical results, it was determined that the vapor intrusion pathway was incomplete within 122 East Date Street and no further action was recommended. This structure remained vacant until it was demolished in September 2017 (212 Environmental 2018).
- 129 West Birch Street – TVPH concentrations were measured above the soil vapor action level in at least one of the sub-slab probes installed within 129 West Birch Street between March 19 and 21, 2013, during and immediately following river stage triggered event EBMP-15. TVPH concentrations were also measured above the indoor air action level on March 19, 2013. Indoor air and sub-slab soil vapor samples were collected within the structure that same day. The concentration of butane, hexane, isopentane, methylcyclohexane, and toluene were greater than the comparison values in sub-slab soil vapor. Butane and isopentane were also reported above the comparison values within the indoor air sample collected within the basement and first floor. Mitigation measures were performed within and outside the structure on March 19, 2013, including supplemental vapor recovery from multipurpose monitoring points MP-078B and MP- 078C, as well as ventilating the structure using a drum fan and portable blower. In addition, on March 20 and 21, repairs were made to the natural gas transmission system in the basement by AAA Heating, Cooling, and Refrigeration. By March 22, 2013, the TVPH concentrations in the sub-slab probes had decreased below the soil vapor action level. A confirmation soil vapor and indoor air sample collected for laboratory analysis on April 1, 2013 showed that concentrations of the constituents of concern were below the comparison values in soil vapor collected beneath 129 West Birch Street; however, isopentane continued to be measured above the comparison value in indoor air. The continued presence of isopentane above the comparison value in indoor air was attributed to an alternative source within the basement (Gannett Fleming 2013c).
TVPH concentrations were measured above the soil vapor and indoor action levels within 129 West Birch Street on April 19, 2013 (during river stage triggered event EBMP-16) and again between June 6 and 10, 2013 (during river stage triggered event EBMP-18). Indoor air and sub- slab soil vapor samples were collected within the structure on April 19, 2013. The concentration of benzene, butane, hexane, and isopentane were greater than the comparison values in sub-slab soil vapor. Butane and isopentane were also reported above the comparison values within the indoor air sample collected within the basement. Mitigation measures including supplemental vapor recovery from multipurpose monitoring points MP-078B and MP-078C, as well as ventilating 129 West Birch Street, were performed during the additional river stage triggered events that occurred in 2013.
TVPH concentrations were again measured above the soil vapor action level in sub-slab probe SS-3 between April 8 and 9, 2014, during river stage triggered event EBMP-19. TVPH concentrations were also measured above the indoor air action level in the basement on April 8, 2014. Indoor air and sub-slab soil vapor samples were collected within the structure on April 9, 2014. The concentration of butane, hexane, isopentane, and methylcyclohexane were greater than the comparison values in sub-slab soil vapor. Butane and isopentane were also reported above the comparison values within the indoor air sample collected within the basement and first floor. Mitigation measures including supplemental vapor recovery from multipurpose monitoring points MP-078B and MP-078C, as well as ventilating 129 West Birch Street, were performed during river stage triggered event EBMP-19. Based on the repeated occurrence of a completed vapor intrusion pathway within 129 West Birch Street during river stage triggered events in 2013 and 2014, three additional nested SVE wells were installed in Effectiveness Zone 1 in December 2014 and connected to the SVE system by February 2015 (Trihydro 2015a).
TVPH concentrations were again measured above the soil vapor action level on May 4, 6, and 9, 2017 during and immediately following river stage triggered event EBMP-34. An indoor air and sub-slab soil vapor sample were collected on May 10 and 11, 2017 from 129 West Birch Street. The analytical results indicated that concentrations of butane, hexane, and isopentane were measured above the sub-slab soil vapor comparison values and isopentane was also reported within indoor air in the basement above the comparison value, following flooding of the Mississippi River. The subsequent weekly in-home screening data demonstrated that the concentrations of petroleum related constituents in indoor air and sub-slab soil vapor decreased rapidly after samples were collected and analyzed by the laboratory. This coincided with a recession of the river stage and improved recovery of petroleum related constituents using the vapor extraction system installed beneath the Hartford Site. In-home screening will continue to be conducted weekly and during river stage triggered events within this structure to determine if additional mitigation measures may be necessary in the future (212 Environmental 2018).
- 135 East Forest Street – TVPH concentrations were measured above the soil vapor action level between May 2 and 9, 2017 during and immediately following river stage triggered event EBMP-34. The TVPH concentrations also exceeded the indoor air action level on May 2 and 4, 2017. An indoor air and sub-slab soil vapor sample were collected on May 3 and 12, 2017, respectively. The analytical results indicated that concentrations of butane and isopentane were measured above the sub-slab soil vapor comparison values. In addition, the concentration of butane, hexane, and isopentane were reported above the comparison values within indoor air, following historic flooding of the Mississippi River. The subsequent weekly in-home screening data demonstrated that the concentrations of petroleum related constituents in indoor air and sub- slab soil vapor decreased rapidly after samples were collected and analyzed by the laboratory. This coincided with a recession of the river stage and improved recovery of petroleum related constituents using the vapor extraction system. In-home screening will continue to be conducted quarterly and during river stage triggered events within this structure. It should be noted that this structure was vacant during river stage triggered event EBMP-34 and remains vacant (212 Environmental 2018).
- 309 North Olive Avenue – TVPH concentrations within soil vapor were routinely measured above the action level in at least one of the sub-slab probes between February 18 and April 5, 2017 and again on May 1, 2017 (during river stage triggered event EBMP-34). TVPH concentrations in the first floor and basement were measured above the indoor air action level periodically during this same timeframe. Indoor air and sub-slab soil vapor samples were collected and submitted for laboratory analysis on February 23, 2017. The analytical results indicated that concentrations of isopentane were greater than the comparison value in sub-slab soil vapor; however, each of the constituents of concern (including isopentane) were reported below the comparison values within indoor air (212 Environmental 2017b).
In response to the continued presence of TVPH concentrations above the action levels within soil vapor and indoor air, the existing ventilation fan in this structure was restarted on April 8, 2017. A Dranjer™ seal was installed in the basement floor drain and the sump was routinely filled with water. On June 30, 2017, vapor extraction began using newly installed well HSVE-112, located directly behind this structure. Following the startup of extraction well HSVE-112, the ventilation fan within this structure was turned off. It should be noted that 309 North Olive Avenue was used as an office by Apex until the end of September 2017 and is currently vacant (212 Environmental 2018).
- 409 North Olive Avenue – TVPH concentrations were measured above the soil vapor action level between April 7 and May 17, 2017 during and immediately following river stage triggered events EBMP-33 and EBMP-34. The TVPH concentrations also exceeded the indoor air action level periodically over this timeframe. An indoor air and sub-slab soil vapor sample were collected between April 10 and 11, 2017 from this structure. The analytical results indicated that concentrations of butane, hexane, isopentane, and methylcyclohexane were present above the sub-slab soil vapor comparison values. In addition, the concentration of butane and isopentane were reported above the comparison values within indoor air. TVPH concentrations decreased within indoor air and sub-slab soil vapor following recession of the river stage and improved recovery of petroleum related constituents using the vapor extraction system. In-home screening continued to be conducted quarterly and during river stage triggered events within this structure until it was demolished in September 2017. It should be noted that this structure was vacant during EBMP-33 and EBMP-34. (212 Environmental 2018).
- 610 North Old St. Louis Road – TVPH concentrations within soil vapor were measured above the action level in sub-slab probe SS-2 on February 14, 2017 during quarterly monitoring. Indoor air and sub-slab soil vapor samples were collected and submitted for laboratory analysis that same day. The analytical results indicated that concentrations of isopentane were greater than the comparison value in sub-slab soil vapor; however, each of the constituents of concern (including isopentane) were reported below the comparison values within indoor air (212 Environmental 2017b). The indoor air and sub-slab soil vapor samples indicated that the vapor intrusion pathway was incomplete within 610 North Old St. Louis Road at that time (212 Environmental 2017b).
However, between May 2 and 23, 2017, TVPH concentrations within soil vapor were routinely measured above the action level in at least one of the sub-slab probes and were also measured above the indoor air action level between May 2 and 16, during and following river stage triggered events EBMP-34 and EBMP-35. Additional indoor air and sub-slab soil vapor samples were collected on May 4 and 9, 2017 respectively, following measurement of TVPH concentrations above the action level in indoor air within this structure. The May 2017 analytical results indicated that concentrations of butane, hexane, and isopentane were greater than their respective comparison value in sub-slab soil vapor; while butane and isopentane was reported above the comparison values within indoor air (212 Environmental 2018).
In response, a ventilation system was installed in the basement of this structure on May 12, 2017. TVPH concentrations initially decreased in indoor air following start-up of the ventilation system but then rebounded above the indoor air action level on May 16, 2017. An additional indoor air sample was collected in the occupied portion of the structure that same day to evaluate potential inhalation risks. While the concentration of constituents of concern in the first floor of the structure were substantially lower on May 16, 2017 compared to the indoor air sample collected on May 4, 2017, butane and isopentane remained above the comparison values within indoor air. Subsequently, an uncovered and abandoned sump located in the basement was sealed between May 16 and 19, 2017. Additionally, supplemental vapor recovery using existing extraction well HSVE-104, connected to the SVE system using aboveground 2-inch vacuum hose extended to well HSVE-107D, began on May 22, 2017. On June 23, 2017, extraction well HSVE-104 was permanently connected to the SVE system. TVPH concentrations have remained below the sub- slab and indoor air action level since these additional measures were employed to mitigate the vapor intrusion pathway within this structure (212 Environmental 2018).
6.5. VAPOR PHASE SUMMARY
Based on the routine effectiveness monitoring results conducted to assess the SVE system, there continues to be a significant vapor source of volatile petroleum hydrocarbons underlying portions of the Village of Hartford, with stable concentrations or only slight changes observed in portions of Effectiveness Zone 1, Zone 5, and Zone 6 overlying the LNAPL smear zone. Expansion of the SVE system in 2015 and 2017, may help to reduce the TVPH concentrations in the North Olive and Rand stratum, but additional corrective measures may also be necessary to achieve meaningful reductions within the LNAPL source zone present primarily within the Main Sand stratum.
Since 2013, there have been 14 structures with a completed vapor intrusion pathway, as shown on Figure 6-12. In more than 70% of these structures, a completed pathway was first identified during a river stage triggered event. Additionally, in many of these cases (including three of the four structures where a completed pathway was identified outside of a river stage triggered event), the nearest vapor extraction well was determined to be inoperable or poorly functioning, when a completed pathway was identified in the structure, as shown in the following table.
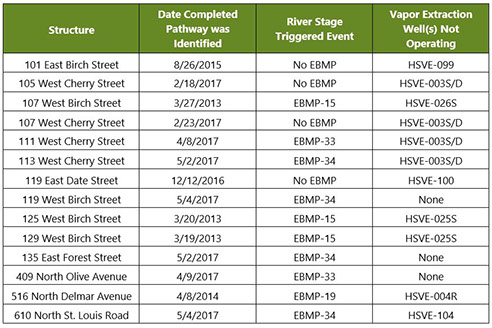
As summarized above, 14 of the 78 (18%) structures that have been monitored since 2013 have had a completed vapor intrusion pathway. As depicted on Figure 6-12, the location of these 14 structures is isolated to specific areas of the Hartford Site as follows:
- There are nine structures within Effectiveness Zone 1 located between West Birch and West Cherry Streets. All of these structures are currently occupied with the exception of 105 West Cherry Street.
- There is one structure in Effectiveness Zone 2 (516 North Delmar Avenue). This structure remains occupied.
- There are two structures in Effectiveness Zone 5 (135 East Forest Street and 409 North Olive Avenue). The structure at 135 East Forest Street is vacant and the structure at 409 North Olive Avenue has been demolished.
- There are two structures in Effectiveness Zone 6 (101 East Birch Street and 119 East Date Street). Both of these structures have been demolished.
There has not been a completed vapor intrusion pathway within any structures located within Effectiveness Zone 3 and Zone 4.
Based on the past five years of in-home monitoring, it appears that while the distribution of LNAPL and lithology underlying a structure play an important role in the vertical migration of volatile petroleum related constituents, the principal factors in determining if the vapor intrusion pathway is complete are: (1) occurrence of river stage triggered events, and (2) operation of the individual vapor extraction wells. It is important to note that while the SVE system is generally effective at mitigating the vapor intrusion pathway, there are conditions under which the SVE system operation has limited effectiveness due to uncontrollable natural conditions. This primarily occurs when the SVE well screens become occluded with groundwater during periods of heavy precipitation combined with a rapid rise in the river stage above major flood stage conditions. When these conditions occur, as was most recently experienced during river stage triggered event EBMP-34, many of the SVE wells are either inoperable or have limited efficacy at reducing TVPH concentrations in the shallow strata.
Operation of the in-home mitigation systems within Effectiveness Zones 1, 2, 5, and 6 may continue to be necessary when these infrequent conditions arise, to eliminate acute risks within structures with a completed pathway. As shown on Figure 6-12, mitigation systems have already been installed within many of the structures within these Effectiveness Zones that currently overlie the LNAPL source zone. The need for additional in-home mitigation systems is continually evaluated based on the results of routine in-home and SVE system effectiveness monitoring. Most recently between March and May 2017, in-home mitigation systems were installed at five structures (105 West Cherry Street, 107 West Cherry Street, 111 West Cherry Street, 113 West Cherry Street, and 610 North Old St. Louis Road). This included the development of an innovative low-flow air injection system for mitigating the vapor intrusion pathway beneath the building slab.
In addition, replacement of individual extraction wells and expansion of the SVE system will be evaluated on an on-going basis through examination of data collected during bi-weekly SVE system monitoring, quarterly effectiveness monitoring, as well as routine in-home monitoring (with a particular emphasis placed on in-home monitoring data collected during river stage triggered events). Routine monitoring of the SVE system, effectiveness monitoring network, and structures overlying the LNAPL smear zone will continue to be an important component of the interim and final corrective measures until volatile constituent concentrations in the LNAPL source are reduced to a point where intrinsic natural attenuation processes are able to limit the migration of petroleum related constituents into structures even during river stage triggered events. An evaluation of the on-going need for the routine operations, monitoring and maintenance of the interim measures should be performed for each remediation management area (described in Section 8.0) separately, as the final RCRA corrective measures program moves forward at the Hartford Site.