
Download Full
Document Here
Conceptual Site Model, March 2018
Hartford Petroleum Release Site
4.0 LIGHT NON-AQUEOUS PHASE LIQUIDS
This section provides a summary of the previously submitted LNAPL Component to the Conceptual Site Model (Trihydro 2014b), as well as a description of the activities completed since May 2014 to resolve gaps within this component of the CSM. This section has been organized into the following subsections:
- Section 4.1 – Summarizes historical data related to LNAPL chemistry and physical properties with a comparison to data collected over the past five years. This subsection also includes an evaluation of LNAPL types, partitioning estimates for petroleum hydrocarbons within the saturated zone, and concentration trends for individual constituents within the LNAPL source.
- Section 4.2 – Describes the lateral and vertical distribution of LNAPL within the various hydrostratigraphic units via examination of the LIF and manual measurements of thicknesses during routine gauging events. This section includes an evaluation of the LNAPL thickness trends in the groundwater monitoring wells and multipurpose monitoring points under various hydraulic conditions.
- Section 4.3 – Describes historical and more recent LNAPL saturation and transmissivity estimates to provide a basis for understanding potential LNAPL recoverability. This subsection also summarizes the qualitative and quantitative modeling that has been completed to better understand LNAPL recovery with a comparison to LNAPL recovery pilot testing performed over the past 15 years, including recent tests conducted in Area A.
An understanding of the chemical and physical properties of the petroleum hydrocarbons released into the subsurface, distribution within various hydrostratigraphic units, and potential recoverability is important for better understanding the CSM for petroleum hydrocarbons partitioning from the LNAPL source zone into the dissolved phase and vapor phase. The information provided in this component of the CSM was one of the considerations in separating the Hartford Site into the proposed remediation management areas described in Section 8.0. For instance, remediation management areas that contain potentially recoverable LNAPL were segregated from those areas which may only contain a residual LNAPL source and those areas where the LNAPL source zone has been depleted.
4.1. LNAPL PROPERTIES
In 2005, 29 LNAPL samples were collected from the Main Sand stratum and characterized as primarily weathered gasoline range hydrocarbons. The secondary product type, where present in these samples, was identified as weathered diesel range hydrocarbons (Clayton 2005). Twelve additional LNAPL samples were collected for laboratory analysis in 2006 and two samples were collected in 2009. These samples were collected from wells screened within the Main Sand stratum, with the exception of monitoring point MP-029C, which is screened within the Rand stratum. LNAPL samples collected from the Main Sand stratum generally consisted of low molecular weight hydrocarbons with chemical characteristics similar to a weathered gasoline. Conversely, the LNAPL sample collected from monitoring point MP-029C consisted of higher molecular weight hydrocarbons and was chemically more similar to a weathered diesel. The product type based on the LNAPL samples collected in 2005 is depicted on Figure 4-1.
An additional seven LNAPL samples were also collected from the Hartford Site in March 2015. The product type within these seven LNAPL samples were generally similar to the historical LNAPL types described in 2005, with one exception. As shown on Figure 4-1, the LNAPL sample collected from monitoring point MP-029D, transitioned from predominantly gasoline to an even mixture of diesel and gasoline. This transition may reflect migration of a weathered diesel from the Rand stratum into the Main Sand stratum.
4.1.1. LNAPL PHYSICAL PROPERTIES
The physical properties of the LNAPL can provide a supporting line of evidence regarding product type. This is especially the case for viscosity, which can vary over large ranges for different product types (e.g., less than 1 centipoise [cp] for gasoline and greater than 100 cp for motor oil). Physical properties of the LNAPL can also significantly affect the efficacy of various recovery approaches (e.g., high viscosity LNAPL is not amenable to recovery using traditional hydraulic approaches). For example, moving from a 1 cp LNAPL to a 5 cp LNAPL can significantly decrease LNAPL recovery rates.
Along with the summary of the product types reported in the historical and recent LNAPL samples, Figure 4-1 presents the kinematic viscosities for LNAPL samples collected from the Rand and Main Sand strata. Viscosities for LNAPL samples collected from the Rand stratum range between 0.55 (MP-083B) and 3.39 cp (MP-029C). The higher viscosity at monitoring point MP-029C is indicative of a heavier-range hydrocarbon, which is consistent with the reported diesel LNAPL type. Most measured viscosities for LNAPL samples collected from the Main Sand stratum are less than 1 cp, with the lowest values generally observed within the central portions of the Hartford Site, consistent with other lines of evidence indicating predominantly light-range hydrocarbons within this stratum. The highest viscosity LNAPL in the Main Sand was measured in samples collected from wells HMW-046C, located in the northwest corner of Effectiveness Zone 1. These higher viscosity measurements may indicate a different LNAPL source, which is consistent with the LNAPL chemistry results. Slightly higher viscosities (but still below 1 cp) were measured in eastern and northeastern portions of the Hartford Site, possibly indicating commingled gasoline and diesel LNAPL in these areas.
4.1.2. LNAPL PARTITIONING ESTIMATES
The LNAPL chemistry results reported for the samples collected in 2006. 2009, and 2015 were used to estimate potential partitioning of individual constituents from the LNAPL to groundwater. Effective solubility estimates for benzene based on the LNAPL chemistry results are presented on Figure 4-2 and are compared to dissolved phase benzene concentrations measured in groundwater samples collected from nearby monitoring locations. The effective solubility estimates for benzene in the Rand and Main Sand strata were reported between 1.3 and 37.8 milligrams per liter (mg/L) for the LNAPL samples. For those locations where samples were collected over multiple events, the effective solubility estimates for benzene have decreased over time.
The effective solubility estimates for benzene were generally similar to the dissolved phase concentrations measured in nearby groundwater samples, except in cases where LNAPL was collected more than a decade prior to the groundwater sample. The general agreement between LNAPL effective solubility and dissolved phase concentrations suggests that dissolution processes have reached equilibrium within the Rand and Main Sand strata; therefore, measurements of individual hydrocarbon constituents in groundwater and LNAPL can be used somewhat interchangeably. This also means that depletion of constituents within the dissolved phase can be interpreted as depletion of individual constituents within the LNAPL, as described in Section 5.3.
4.2. LNAPL DISTRIBUTION
LNAPL distribution is affected by several factors including but not limited to the lithology, groundwater fluctuations, release history, and interim recovery efforts. As detailed in Section 3.0, approximately 3.2 million gallons of LNAPL have been recovered from beneath the Hartford Site, with 1.3 million gallons removed via skimming primarily within the Main Sand stratum and another 1.9 million gallons recovered through operation of the SVE system predominantly focused on the shallow stratum (North Olive, Rand, and Main Silt stratum). While the extent and mass of petroleum hydrocarbons has been reduced over the past four decades via these interim remedial measures, LNAPL remains beneath many portions of the Hartford Site.
In 2004, 66 LIF borings were installed to evaluate the nature and distribution of hydrocarbons within the stratigraphic units beneath the Hartford Site using the Rapid Optical Screening Tool (ROST™). An additional 43 LIF borings were installed in 2005 using ROST™. The LIF boring locations are depicted on Figure 4-3. As the historical LIF data provides information about the horizontal and vertical extent of LNAPL, these data were incorporated into the Leapfrog Hydro™ 3D visualization model. The depth discrete LIF measurements were modeled using a linear interpolant to create a 3D visualization of the LNAPL distribution. The linear interpolant was adjusted to reflect the general understanding of the LNAPL morphology. For instance, LNAPL tends to spread along the contact between the more permeable, hydrostratigraphic units and the less permeable clays.
An oblique view of the LIF boring locations and depiction of the various LNAPL types beneath the Hartford Site are shown on Figure 4-4. Cross sections showing the LNAPL distribution relative to the general stratigraphic interpretation of the subsurface are provided in Appendix B. The observed waveforms were categorized into three general LNAPL types including light-, mid-, and heavy-range hydrocarbons. In this case, “heavy-range” generally corresponds to LNAPL with a higher proportion of diesel-range compounds than the light-range hydrocarbons which are comprised almost entirely of gasoline-range compounds, as shown on Figure 4-4. Heavy-range hydrocarbons were primarily identified on North Olive Avenue between the intersections of East Date and Watkins Streets within the Main Sand stratum. Mid-range hydrocarbons were observed in the northern portion of the Hartford Site within the Main Sand and EPA strata, with several locations also showing similar LNAPL types in the overlying Rand and North Olive strata. Light-range hydrocarbons were identified within the central and southern portions of the Hartford Site within the Main Sand stratum, with select locations showing similar light range hydrocarbons in the overlying EPA, Main Silt, Rand, and North Olive strata. It should be noted that while the model indicates the presence or absence of LNAPL (i.e., normalized fluorescence measurements above background), it does not provide any indication of LNAPL saturations or potential recoverability. A detailed summary of the historical distribution of LNAPL within each of the hydrostratigraphic units is provided in the LNAPL Component to the Conceptual Site Model (Trihydro 2014b). The following subsections describe changes in the LNAPL distribution within the hydrostratigraphic units based on a limited LIF assessment conducted in 2013 and routine gauging results over the past five years.
4.2.1. COMPARISON OF HISTORICAL AND RECENT LIF RESULTS
A total of 24 LIF borings were installed in September 2013 across the Hartford Site using an Ultraviolet Optical Screening Tool (UVOST™). The borings were installed at previous ROST™ monitoring locations to assess changes in the LNAPL distribution within the hydrostratigraphic units, as shown on Figure 4-3. Each boring was installed to a minimum of five feet below the vertical smear zone limits.
Both the ROST™ and UVOST™ make use of fluorescence and data acquisition systems developed wholly or in part by Dakota Technologies. These two methods differ primarily in the laser and associated wavelength used to excite polycyclic aromatic hydrocarbons (PAHs) within the LNAPL (290 and 308 nanometer wavelengths, respectively). The PAH mixtures within the LNAPL emit photons of a distinctive wavelength irrespective of the excitation wavelength, although the intensity of the response may vary. By sampling the total fluorescence at different wavelength channels (which are nearly identical for both tools), a multi-wavelength waveform is generated. The waveform allows simultaneous description of the spectral and temporal qualities of the fluorescence with depth and can be used to identify different product types. The waveform data are referenced and displayed as a percent of the response compared to the calibration reference emitter (RE). The RE is similar to a calibration gas used in a flame ionization or photoionization detector and is placed on the sapphire probe window before collecting fluorescence data at each boring. The same RE is used for the ROST™ and UVOST™ (that is to say, the RE produces the same multi-wavelength waveform). Fluorescence measurements generated in the borings are normalized to the RE measurements which allows for spatial and temporal comparisons of the fluorescence results despite changes in the optics, laser energy drift, window, mirror, etc.
Both the ROST™ and UVOST™ readily detect most light- to mid-range product types including diesel and gasoline. The fluorescence response for these product types are generally linear, with higher concentrations of PAHs within a given product type resulting in a greater percent response relative to the RE (excluding any matrix interferences described below). With respect to gasoline, ROST™ will potentially have an advantage over UVOST™ since its laser system produces a shorter wavelength.
But much of this advantage may be normalized through comparison of the LIF results from ROST™ and UVOST™ to the same RE. This is generally observed in the waveforms for the ROST™ borings installed in 2004 and 2005 when compared to the UVOST™ borings installed at the Hartford Site in 2013. The fluorescence results from the 24 collocated borings are presented as mirror images on the figures included in Appendix C. The scale for the total waveform from the ROST™ was adjusted in the horizontal direction (i.e., stretched or compressed) so the percent fluorescence response (%RE) was equivalent to that of the corresponding scale for the UVOST™ waveform.
This comparison of the ROST™ and UVOST™ waveforms is semi-qualitative as there are several sources of variation with respect to fluorescence response beyond the aforementioned differences in the ROST™ and UVOST™. For instance, only the relative fraction of LNAPL that is optically accessible at the sapphire window of the probe can contribute to the fluorescence response. Therefore, heterogeneities in the lithologic setting and LNAPL distribution within the soil matrix can affect the fraction of LNAPL present within a few centimeters of the window. In addition, the method used to install the borings (e.g., cone penetrometer, direct push) can result in differing physical response of the soils and LNAPL such that the diameter of probe, push speed, and other factors combine to influence how much LNAPL gets preferentially drawn towards or pushed away from the sapphire window.
These figures provided in Appendix C show the current vertical distribution of LNAPL within the hydrostratigraphic units at these 24 locations compared to the historical results for borings installed in 2004 and 2005. Temporal changes in the vertical extent of the LNAPL and maximum fluorescence response within a location may indicate preferential depletion of the smear zone due to a combination of interim measures, redistribution due to fluctuating groundwater elevations, and natural smear zone depletion processes. Apparent temporal changes (subject to the differences in the ROST™ and UVOST™, inherent variation associated with LIF, and subsurface heterogeneity described above) were most prevalent within the North Olive stratum and within the deeper hydrostratigraphic units along the western and southern boundaries of the smear zone.
4.2.2. NORTH OLIVE STRATUM
As shown on the LIF comparisons presented in Appendix C, at those locations where LNAPL was identified in 2004 and 2005 via a fluorescence response (Figures HROST-002, -004, -007, -040, -049, - 052, -090, and -113), there was either no response or a significantly reduced response observed within the North Olive stratum in 2013. This includes locations situated along the margins, as well as the interior portions of the smear zone. Petroleum hydrocarbons within this shallowest hydrostratigraphic unit are being targeted for recovery using the SVE system. Natural smear zone depletion may also be occurring within the North Olive stratum via (1) volatilization and subsequent biodegradation within the vadose and (2) nutrient delivery within rainwater infiltrate and subsequent oxidation by petrophilic bacteria in the saturated zone.
As summarized in Table 4-1, LNAPL has been detected within five monitoring locations screened within the North Olive stratum (HMW-044A, HMW-054A, MP-047A, MP-074, and MP-108B) over the past five years. Four of these occurrences represent a single, isolated detection of LNAPL that did not occur during subsequent gauging events. Multipurpose monitoring point MP-108B is the only monitoring location screened within the North Olive stratum in which LNAPL has been measured during more than one gauging event, with six occurrences between April 2013 and January 2016 (LNAPL thicknesses ranging from 0.02 to 0.31 feet). Monitoring point MP-108B is a 1-inch piezometer located in the southern portion of Effectiveness Zone 6. Monitoring point MP-108B has been dry since April 2016.
4.2.3. RAND STRATUM
Comparing the LIF results from 2004 and 2005 to the results from 2013 (Appendix C), there was either no change in the LIF response (HUVOST/HROST -004, -005, -040, -052, and -130) or a reduced fluorescence response (HUVOST/HROST-013, -030, -090, and -113) observed in the Rand stratum. Significant decreases in the fluorescence response in the Rand stratum were observed at locations situated along the margins, as well as the interior portions of the smear zone. There was a slight increase in the LIF response and change in the observed LNAPL type within the Rand Stratum observed in location HROST-078/UVOST-078 between 2005 and 2013. This boring is located inside the smear zone within Effectiveness Zone 5.
Of the 49 groundwater monitoring wells and multipurpose monitoring points screened within the Rand stratum that are routinely gauged, LNAPL has been detected within 18 locations at least once between September 2013 and December 2017. Table 4-1 provides a summary of the LNAPL thicknesses measured within monitoring locations screened within the Rand stratum and the hydraulic condition (e.g., confined, unconfined) of the LNAPL during the gauging event.
LNAPL thickness maps were generated using data collected from the Rand stratum for three historical and three recent fluid level gauging events. These events were selected to represent the following conditions:
- 10th Percentile of Average Groundwater Conditions in the Main Sand Stratum – Figures 4-5 and 4-6 present the historical and recent LNAPL thickness measurements collected in January 2006 and March 2015 within the Rand stratum when low groundwater conditions were present.
- 50th Percentile of Average Groundwater Conditions in the Main Sand Stratum – Figures 4-7 and 4-8 present the historical and recent LNAPL thickness measurements collected in April 2007 and July 2017 within the Rand stratum when average groundwater conditions were present.
- 90th Percentile of Average Groundwater Conditions in the Main Sand Stratum – Figures 4-9 and 4-10 present the historical and recent LNAPL thickness measurements collected in July 2008 and January 2016 within the Rand stratum when high groundwater conditions were present.
On these figures as well as Table 4-1, LNAPL thicknesses were classified into four general categories:
(1) highly unconfined (i.e., LNAPL elevation greater than 4 feet below the confining clay contact), (2) unconfined (i.e., LNAPL elevation between 0 and 4 feet below the confining clay contact), (3) confined (i.e., LNAPL elevation between 0 and 4 feet above the confining clay contact), and highly confined (i.e., LNAPL elevation greater than 4 feet above the confining clay contact). It is well understood that LNAPL thicknesses become exaggerated within monitoring locations at the Hartford Site when the LNAPL elevation is above the overlying clay contact. During confining conditions (created when LNAPL within the stratum intercepts and is forced against overlying finer-grained clay), hydrostatic forces drive LNAPL into wells that behave essentially as pressure relief points. When this occurs the top elevation of the LNAPL in a monitoring location will be higher than the base of the confining unit since it is under hydrostatic pressure resulting in an exaggerated (referred to as apparent) LNAPL thickness. When LNAPL is confined in a well, the initial mass present within the casing is recoverable; however, recovery of additional mobile LNAPL is minimal since much of the mass is trapped underneath the water table. Pilot testing of LNAPL recovery using MPE and DPE approaches under confining conditions was previously performed in Area A and is further described in Section 4.3.1.
In general, LNAPL within the Rand stratum is most frequently observed in Effectiveness Zone 5 and Zone 6. Unconfined LNAPL was only measured in a few monitoring locations under low and average groundwater conditions at thicknesses less than 1-foot. Under high groundwater conditions, the number of locations reported with LNAPL, as well as the LNAPL thicknesses within individual locations increased. In July 2008, LNAPL was detected across a broader area and at greater thicknesses compared to the January 2016 gauging event. LNAPL was mostly confined under the high groundwater conditions observed in July 2008; however, was primarily unconfined in January 2016.
LNAPL thickness trends for three monitoring locations (well HMW-044B, multipurpose monitoring point MP-029C, and monitoring point MP-053B) screened in the Rand stratum are provided in Appendix D. LNAPL thickness trends have been separated for highly unconfined, unconfined, confined, and highly confined LNAPL conditions within each monitoring location. There is not a discernable trend in the LNAPL thicknesses within any of these monitoring locations, with the coefficient of variation (r2), which is a measure of the representativeness of the best fit trend line to the measured data), reported below 0.5 for each of the hydraulic conditions for the three monitoring locations screened within the Rand stratum. A coefficient of variation of 1 indicates that the trend line extended through all of the measured data.
4.2.4. MAIN SILT STRATUM
As shown on the figures comparing the historical and more recent LIF results included in Appendix C, a fluorescence response was only observed within the Main Silt stratum at a single location, HUVOST/HROST-029. The LIF response decreased within this location between 2004 and 2013.
As summarized in Table 4-1, of the 51 monitoring locations screened within the Main Silt stratum, LNAPL has only been detected within two monitoring locations during the past five years, with thicknesses ranging from 0.08 to 2.54 feet. Both locations (multipurpose monitoring points MP-038B and MP-048B) are situated in Effectiveness Zone 2.
4.2.5. EPA AND MAIN SAND STRATA
A comparison of the historical and more recent LIF results, provided in Appendix C, indicate a reduced LIF response within the borings installed along the western (HROST/HUVOST-013, -019, - 028, -078, -090, and -099) and southern (HROST/HUVOST-049 and -072) edges of the smear zone within the Main Sand and EPA strata. Similar depletion of the smear zone was generally not observed within the co-located borings installed in the interior portions of the smear zone, with the exception of co-located borings HROST/HUVOST-029, -030, -128, and -129. However, decreases in the fluorescence intensity at these locations was not coupled with significant decreases in the vertical thickness of the smear zone observed via LIF.
Of the 132 groundwater monitoring wells and multipurpose monitoring points screened within the Main Sand and EPA strata that are routinely gauged, LNAPL has been detected within 70 locations at least once between 2013 and 2017 (Table 4-1). LNAPL thicknesses have ranged from 0.01 to 20.22 feet and are strongly influenced by changes in hydraulic conditions. LNAPL thickness maps were generated using data collected from the Main Sand stratum for three historical and three recent fluid level gauging events. These events were selected to represent the following conditions.
- 10th Percentile of Average Groundwater Conditions in the Main Sand Stratum – Figures 4-11 and 4-12 present the historical and recent LNAPL thickness measurements collected in January 2006 and March 2015 when low groundwater conditions were present within the Main Sand stratum.
- 50th Percentile of Average Groundwater Conditions in the Main Sand Stratum – Figures 4-13 and 4-14 present the historical and recent LNAPL thickness measurements collected in April 2007 and July 2017 when average groundwater conditions were present within the Main Sand stratum.
- 90th Percentile of Average Groundwater Conditions in the Main Sand Stratum – Figures 4-15 and 4-16 present the historical and recent LNAPL thickness measurements collected in July 2008 and January 2016 when high groundwater conditions were present within the Main Sand stratum.
LNAPL is observed in Effectiveness Zone 1, 2, 5, and 6 under the full range of hydraulic conditions. LNAPL was not measured outside of the inferred smear zone limits during any of the historical and recent gauging events. LNAPL was predominantly unconfined and thinner under low groundwater conditions (maximum thickness of 2.76 feet in January 2006 and 3.61 feet in March 2015) compared to average groundwater conditions (maximum thickness of 6.41 feet in April 2007 and 15.3 feet in July 2017) and high groundwater conditions (maximum thickness of 19.04 feet in July 2008 and 20.22 feet in January 2016). LNAPL remained confined along West Birch Street in monitoring points MP- 079C (in January 2006 and March 2015) and MP-080C (in January 2006) despite the low groundwater conditions.
LNAPL becomes predominantly confined and highly confined under average and high groundwater conditions. The LNAPL thicknesses were typically greater in the Main Sand stratum in July 2017 compared to April 2007 under average groundwater conditions but were generally thicker in July 2008 compared to January 2016 under high groundwater conditions.
Of the four monitoring locations screened within the EPA stratum, two locations (HMW-048C and MP-085C) have contained measurable LNAPL since 2013 (Table 4-1). LNAPL thicknesses ranged between 0.01 and 0.14 feet within monitoring point MP-085C and 0.2 and 17.73 feet in monitoring well HMW-048C, which is located approximately 275 feet to the northwest of monitoring point MP- 085C.
LNAPL thickness trends for the monitoring locations screened in the Main Sand stratum are provided in Appendix D. LNAPL thickness trends have been separated for highly unconfined, unconfined, confined, and highly confined LNAPL conditions within each monitoring locations. The following bullets summarize the LNAPL thickness trends observed within each of the Effectiveness Zones where LNAPL is present in the Main Sand stratum.
- Effectiveness Zone 1 – LNAPL thickness trends were evaluated within five monitoring locations (wells HMW-045C and HMW-046C and monitoring points MP-078D, MP-079C, and MP-080C) installed in Effectiveness Zone 1. There is not a discernable trend in the LNAPL thicknesses within any of these monitoring locations, with the coefficient of variation measured below 0.5, except for the trend observed in monitoring well HMW-046C under confined conditions. The LNAPL thicknesses in this location shows an increasing trend under confined conditions over the past 15 years of monitoring. Monitoring well HMW-046 is located northeast of the Hartford Community Center. It should be noted that LNAPL was first detected in monitoring point MP-078D (located on the corner of West Arbor Street and North Old St. Louis Road) beginning in 2014. Changes in the LNAPL morphology within the northwest portion of Effectiveness Zone 1 represents a data gap in the CSM that was previously described within the revised Summary of Lines of Evidence Indicating a Potential Alternate Source of Petroleum Hydrocarbons beneath Soil Vapor Extraction System Effectiveness Zone 1 (212 Environmental 2016d) and is further described in Section 7.0.
- Effectiveness Zone 2 – LNAPL thickness trends were evaluated within four monitoring locations (monitoring points MP-032B, MP-034C, MP-039C and MP-049C) installed in Effectiveness Zone 2. There are no discernable trends for either of these two monitoring locations, with LNAPL thicknesses appearing to be stable over time within the Main Sand stratum.
- Effectiveness Zone 5 – LNAPL thickness trends were evaluated within four monitoring locations (wells HMW-044C and monitoring points MP-055C, MP-056C, and MP-136) installed in Effectiveness Zone 5. There are no discernable trends observed in LNAPL thicknesses within these monitoring locations, except for locations HMW-044C and MP-055C. The coefficient of variation for the decreasing trend observed under highly unconfined and unconfined conditions within these three monitoring locations exceeded 0.5. The thicknesses of LNAPL appeared to be stable or decreasing since 2004 within the monitoring locations screened in the Main Sand stratum in Effectiveness Zone 5.
- Effectiveness Zone 6 – LNAPL thickness trends were evaluated within nine monitoring locations (wells HMW-008, HMW-010, and HMW-022 and monitoring points MP-029D, MP-037D, MP- 041C, MP-042C, MP-046C, and MP-047C) installed in Effectiveness Zone 6. There are no discernable trends for any of these monitoring locations, with the exception of location MP- 046C. The coefficient of variation for the decreasing trend observed under highly unconfined conditions exceeded 0.5. LNAPL thicknesses appear to be stable or decreasing in Effectiveness Zone 6 over time within the Main Sand stratum.
4.3. LNAPL RECOVERABILITY
LNAPL recoverability has been previously assessed by several methods including: (1) soil coring and petrophysical analysis, (2) LNAPL transmissivity estimates, and (3) LNAPL recovery pilot testing. hese data are reviewed in the remainder of this section with a focus on the relationship of the hydraulic conditions (e.g. confined, highly unconfined) and LNAPL recoverability estimates.
In order to better understand LNAPL recoverability at the Hartford Site, it is important to review general heuristics for LNAPL behavior and movement within the unconsolidated sediments. LNAPL, when present, shares available pore space between sediment grains with water and air. In order for LNAPL to be mobile and recoverable it needs to be continuous or connected within the pore spaces. Within the saturated zone, where the pore spaces are primarily filled with water, LNAPL is generally present as less connected globules within the smaller pore spaces (2-phase conditions). That is, while some of the LNAPL might be connected and potentially capable of mobilizing to a well, much of it is often present as separate ganglia due to the majority of pore space being filled with water.
Within the capillary fringe and vadose zone where water content is lower and air is also present (3- phase conditions), LNAPL tends to be more connected within the larger pore spaces. Put another way, LNAPL residual saturation can vary depending on whether 2-phase or 3-phase conditions are present (Charbeneau 2007). When LNAPL saturations are high and/or water saturations are low, LNAPL is better connected and therefore potentially mobile (i.e., the LNAPL is above the residual saturation). LNAPL preferentially moves within coarse-grained sediments such as sand and gravel (i.e., lower pore entry pressure), and is less able to migrate through fine-grained sediments such as silt and clay (assuming similar water content within the pore space).
4.3.1. LNAPL SATURATION
Soil coring and petrophysical analysis were conducted in 2005. The purpose of this sampling and analysis was “an evaluation of LNAPL recoverability within differing geological and hydrogeological settings” (Clayton 2006). Six soil cores were collected from the smear zone at the locations displayed on Figure 4-3. One location, boring HCSB-1, was installed along the eastern boundary of the Hartford Site along North Olive Avenue (referred to as Area A), and the other five were obtained within the smear zone to the north and west of boring HCSB-1. Core samples were collected within the Main Sand stratum from each boring. Core samples were also collected from the shallower strata from a subset of the borings for petrophysical analysis.
A total of 73 plugs were analyzed for pore fluid saturations. LNAPL was detected in all but two of the plugs (HCSB-1 at 21.9 feet and HCSB-2 at 29.3 feet), with detected saturations ranging from 0.3% pore volume (HCSB-2 at 31.5 feet and HCSB-4 at 29.5 feet) to 40.2% pore volume (HCSB-1 at 31.6 feet). The total fluid saturations are displayed graphically for plugs obtained below the water table in the Main Sand on Figure 4-17. Water saturations were considerably higher than LNAPL saturations, with the exception of sample HCSB-1 at 27.3 feet. This suggests that in situ LNAPL saturations were generally low beneath the water table at the time of sampling. However, there is a limitation to this inference. As shown on Figure 4-17, between 14% and 40% of the plug pore volumes were reported as being absent of both LNAPL and water (shown as Sa on Figure 4-17). While it is possible that this indicates significant quantities of gases are trapped below the water table, it is also possible that fluids were preferentially lost from the cores during collection. If these fluids were primarily water, then this would not affect the inference that LNAPL saturations at many of the coring locations were relatively low. However, if the majority of fluids that drained from the cores during collection were primarily LNAPL, this would indicate that LNAPL was not adequately measured in the cores.
For comparative purposes, in 2014 soil cores were collected from four intervals (28-29 ft-bgs, 31-32 ft-bgs, 35-36 ft-bgs, and 40-41 ft-bgs) across the smear zone in the Main Sand stratum as part of the additional LNAPL recovery pilot testing performed in Area A. LNAPL saturation estimates were made based on the total petroleum hydrocarbon concentrations reported in soil samples collected at selected intervals. The LNAPL saturation estimates are shown on Figure 4-17. The saturation estimates for individual samples ranged from 0.31 to 9.04%. The average LNAPL saturation within the upper, middle, and lower portions of the smear zone ranged from 1.79 to 3.69%, with an overall saturation across the smear zone of 2.72%. These estimates were far less than historical saturation estimates for boring HCSB-1 installed in Area A and were well below saturations that might be indicative of mobile LNAPL within sands and gravels that make up the Main Sand stratum. While the range of residual saturation depends on the LNAPL type and lithologic setting, as well as saturated versus unsaturated conditions, a LNAPL saturation endpoint of 10% is considered a typical saturation value below which LNAPL is considered immobile (MADEP 2016).
4.3.2. LNAPL TRANSMISSIVITY
LNAPL transmissivity is a commonly used metric to assess the potential for hydraulic recovery of LNAPL under the specific conditions tested. LNAPL transmissivity can be estimated by analyzing data collected via multiple methods, such as LNAPL baildown tests, manual skimming, and continuous recovery (ASTM 2011). LNAPL transmissivities have been measured at the Hartford Site using various methods since 2004.
The dynamic nature of groundwater elevations within the Main Sand stratum is one of the most important conditions affecting LNAPL transmissivity. As stated by WSP (2012), “. . . as the water table fluctuates, some of the mobile LNAPL at the water table may travel with the water table or it may be submerged (rising water table) or released (falling water table). As a result, the mobile and residual LNAPL saturations can decrease or increase.” Groundwater elevations in the Main Sand stratum rise and fall in response to the Mississippi River elevation and precipitation events, with hydraulic conditions frequently transitioning between unconfined and confined conditions.
As shown on Table 4-2, a total of 96 quantitative LNAPL transmissivity estimates were completed for 26 different groundwater monitoring wells and multipurpose monitoring points between 2004 and 2012. These LNAPL transmissivity estimates were generally based on LNAPL baildown testing, with the exception of recharge data following MPE testing in 2005. No LNAPL transmissivity values are available between 2006 and 2008. Reported values span multiple orders of magnitude, from a low of 0.0010 square feet per day (ft2/day) in monitoring point MP-052C in August 2005 to a high of 94 ft2/day in monitoring point MP-050C in May 2005. The transmissivity estimates were conducted at a minimum groundwater elevation of approximately 396 ft-amsl and a maximum of 410.5 ft-amsl.
These LNAPL transmissivity estimates can be compared to the minimum endpoint (0.3 ft2/day) previously proposed for hydraulic recovery of LNAPL (WSP 2012). In 2004 and 2005, 69% (46 of 67) of the estimated LNAPL transmissivities were above this threshold, while in 2009 and 2010, 60% (15 of 25) of the values were above this threshold. In 2011 and 2012, none (0 of 4) of the values were above this threshold. Overall, these results might be an indication of decreasing LNAPL recoverability at the Hartford Site. That is, the quantity of LNAPL above residual saturations in the Main Sand stratum has decreased as a result of interim measures, natural source zone depletion, and continued smearing of LNAPL due to groundwater fluctuations. However, it should be noted that there were significant variations in the historical LNAPL transmissivity estimates (including estimates made at single location). This variation in the LNAPL transmissivity estimates is attributed to different test methods and non-static hydraulic conditions during testing (Trihydro 2014b).
In December 2014, baseline LNAPL transmissivity testing was performed in two wells screened within the Main Sand stratum in Area A as part of additional LNAPL recovery pilot testing. LNAPL transmissivity values could not be calculated, as the relatively thin LNAPL thicknesses and low drawdown during recharge rendered plots of discharge versus drawdown with significant scatter that could not be processed quantitatively. Additional LNAPL baildown testing was proposed to be conducted during the focused pumping pilot test once maximum, steady state conditions were achieved; however, prior to termination of the pilot test in March 2015, the LNAPL thickness in each of the monitoring locations within Area A were measured below the requisite 0.5-feet minimum to conduct baildown testing. These results support that LNAPL transmissivity may have decreased beneath Area A, and LNAPL recovery via hydraulic means may not be effective as described in the subsequent section.
4.3.3. LNAPL RECOVERY PILOT TESTING
The Dual Optimal LNAPL Response (DOLR) conceptual model was developed (H2A 2006) to explain the occurrence and potential recoverability of LNAPL under various hydraulic conditions. The DOLR model applies to the LNAPL present in the Main Sand stratum, where groundwater frequently transitions from unconfined to confined conditions. The DOLR model is most useful in conceptualizing LNAPL recovery within the Main Sand stratum, where the majority of LNAPL appears to be present beneath the Hartford Site (Trihydro 2014b).
The first part of the DOLR model states that under confining conditions (created when groundwater within the Main Sand stratum intercepts and is forced against overlying finer-grained clay layers), hydrostatic forces drive LNAPL into wells that behave essentially as pressure relief points. This is schematically depicted in the first panel on Figure 4-18. As the water table rises, some LNAPL in the smear zone also rises within connected pore spaces between the coarse-grained sediments and eventually contacts the bottom of the overlying clay layer. Increases in the water table are directly proportional to increasing LNAPL thicknesses, as the LNAPL remains confined against the overlying clay and unable to displace water from the smaller pore spaces. Although the LNAPL is unable to move any further vertically, it is able to move laterally along the contact of the coarser Main Sand stratum and overlying confining clay. This potential for lateral movement is limited under these confined conditions because any portion of the pore space not occupied by LNAPL tends to be filled with water (2-phase conditions). Still, if a well is screened across the contact of the confining clay and the Main Sand stratum, some fraction of LNAPL can move laterally into the well. Such a condition could mean relatively high initial LNAPL recoverability from the well if mobile LNAPL can collect at the base of the confining layer and water in the well does not exert a significant backpressure. However, under this condition the “mass of available mobile LNAPL is minimal since much of the LNAPL mass is trapped underneath this high water table” (p. 59 of Appendix E within the 90% Design Report (Clayton et al. 2006)). As LNAPL is removed from the formation adjacent to the well, LNAPL saturations may decrease as water saturations increase, resulting in reduced recoverability. Only if LNAPL in the vicinity of the recovery well remains above residual saturations (i.e., has sufficient connectivity in this 2-phase condition) would recovery remain sustainable.
4.3.3.1. LNAPL RECOVERABILITY UNDER CONFINED CONDITIONS
As described in Section 3.1, the Hartford Working Group performed short-term, multiphase extraction pilot testing, which was defined as high vacuum recovery of LNAPL, vapor, and groundwater using a stinger placed slightly above the LNAPL-air interface in 2005. These pilot tests were performed cyclically (not continuously) at each location using temporary equipment, with the exception of production wells RW-004A and RW-005, where continuous testing was conducted using temporary equipment. The following table summarizes the results of the short term, multiphase extraction pilot tests conducted in 2005:
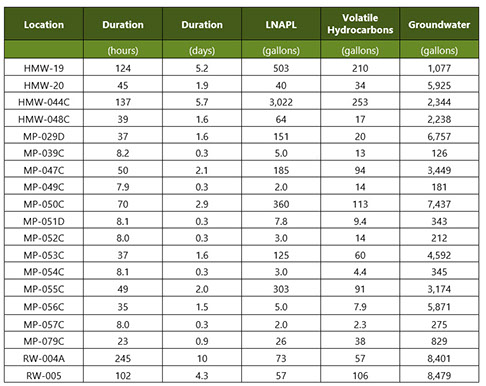
The most successful multiphase extraction pilot test (in terms of LNAPL and volatile petroleum hydrocarbon recovery) was conducted in groundwater monitoring well HMW-044C, located in Area A.
Pilot testing of LNAPL recoverability under confining conditions was performed in Area A between October 2011 and January 2012 with the primary objective of evaluating previously selected technologies for LNAPL recovery including SVE, MPE, and DPE. Area A includes a small portion of the Hartford Site located on North Olive Avenue between East Forest and East Elm Streets (Figure 1- 1). Area A was identified as the most suitable location for pilot testing the selected technologies described in the 90% Design Report based on elevated LNAPL saturations and transmissivities within this portion of the Hartford Site (Clayton, et al. 2006). Pursuant to United States 7th Circuit District Court Chief Judge Herndon’s Decision (Docket Number 05-CV-242-DRH) dated July 28, 2008, Apex was required to implement a final remedy at the Hartford Site including activities described within the 90% Design Report (Clayton, et al. 2006). The proposed design was not considered final (in other words this was not a 100% design), due to several factors including: (1) the complex and heterogeneous lithologic setting, (2) the large size and complex distribution of the LNAPL source zones, (3) the significant variability in sustainable LNAPL recovery rates observed during previous short duration LNAPL recovery tests, and (4) the uncertainty in the optimal system configuration and operations within a residential setting. As a result, the 90% Design Report (Clayton, et al. 2006) envisioned a phased implementation approach, with each step dependent upon testing, evaluation, and analysis prior to full implementation. During the preliminary implementation phase, permanent systems would be used for the SVE portion of the remedy, while portable systems would be utilized for pilot testing of MPE and other remedial alternatives (if appropriate), beginning in Area A. It was determined that permanent, fixed remedial systems would be constructed for MPE or other remedial alternatives following completion of the preliminary implementation phase and selection of an optimal remedial approach(s).
As described in the Light Non-Aqueous Phase Liquid Recovery Pilot Test Interim Report (WSP 2012), groundwater and LNAPL were confined within the test well MPE-A001 at the start and throughout most of the pilot testing activities conducted between November 2011 and January 2012. Well MPE- A001 is located in Area A and screened across the top of the Main Sand stratum. Immediately prior to testing, the LNAPL thickness in the test well measured 3.24 feet, greater than that typically observed under unconfined conditions, which is consistent with exaggerated LNAPL thicknesses observed in many of the wells under confined conditions. The LNAPL-water interface was present within the screened interval of the well. However, once a vacuum was induced on well MPE-A001 to evaluate SVE, the screened interval became submerged (also referred to as occluded).
MPE was subsequently tested on November 7 through November 10, 2011. A stinger was placed in the well with an applied vacuum for three hours the first day and nearly continuous thereafter. The stinger diameter and elevation varied during the test, and airflow ranged from 13 to 85 scfm. The applied vacuum achieved removal of fluids from well MPE-A001 with a maximum drawdown of 2.2 feet but did not lower the fluid levels to below the top of the screen. Although an exaggerated LNAPL thickness was measured prior to testing, LNAPL was not recovered using MPE during the test. Approximately 6,900 gallons of groundwater were extracted.
Pilot testing of DPE was planned but based on the lack of significant drawdown during MPE testing within well MPE-A001, a pumping test was performed instead to assess achievable drawdown within the well. Following a step test, a constant rate pump test was conducted at 20 gpm for 6.5 hours. Approximately 9 feet of drawdown was observed in well MPE-A001, exposing approximately 8 feet of the well screen. However, the LNAPL thickness in the well decreased from 2.89 feet to 0.14 feet during the pump test. Fluid level monitoring within the nearby wells indicated some influence within 50 feet of the pumping well, but LNAPL thicknesses did not increase in any of the surrounding wells during the pump test.
Overall, the pilot test resulted in no measurable LNAPL recovery using MPE, and insufficient drawdown in the well to expose the screen due to high transmissivities within the Main Sand stratum. Additionally, groundwater pumping did not affect LNAPL thickness in well MPE-A001 or nearby monitoring wells over the 6.5-hour pump test duration. The results suggested that MPE is not sufficient to achieve LNAPL recovery in Area A under confined conditions.
It should be noted that LNAPL transmissivity testing conducted in October 2011 during confined conditions and in January 2012 during unconfined conditions indicated an increase in transmissivity from 0.0005 and 0.04 ft2/day to 0.02 and 0.09 ft2/day, respectively. The increase in LNAPL transmissivity, observed as the ambient water table decreased, suggested that pumping under unconfined conditions might be a viable approach for additional LNAPL recovery in Area A.
4.3.3.2. LNAPL RECOVERABILITY UNDER UNCONFINED CONDITIONS
The second part of the DOLR model states that under unconfined conditions, LNAPL can vertically drain from the coarse-sediments within the Main Sand stratum as the water table falls below the confining clay lenses. Under unconfined conditions (i.e., when the water and LNAPL are 0 to 4 feet below the overlying clay contact), LNAPL thicknesses in wells can be relatively low because the confining pressure is no longer present and “much of the LNAPL is still submerged and entrapped under the water table” (p. 60 of Appendix E within the 90% Design Report (Clayton et al. 2006)). A small fraction of available LNAPL will subsequently accumulate above the water table, as depicted in the second panel of the DOLR model included as Figure 4-18.
It was hypothesized that If the water table decreased further, “much of the submerged residual LNAPL drains from the Main Sand stratum, (and) larger volumes of mobile LNAPL are available to accumulate in wells” (p. 60 of Appendix E within the 90% Design Report (Clayton et al. 2006)). Under this model, the further the water table falls, the more LNAPL drains and accumulates near the water table and LNAPL could move more easily within the Main Sand stratum. If the screen interval within a well intersects the mobile LNAPL interval and the water table is sufficiently low for a sustained period, LNAPL could enter it and have an elevation that is consistent with the vertical interval of recoverable LNAPL in the formation (i.e., no exaggerated thickness). As shown on the third panel on Figure 4-18, it was believed that sustained LNAPL recovery may be attainable under these lower water table conditions due to a larger mass of mobile LNAPL present under 3 phase conditions (i.e., unsubmerged) and therefore potentially recoverable.
In order to test LNAPL recovery under unconfined conditions, as described in the second part of the DOLR model, an additional pilot test was conducted within Area A. The purpose of the additional pilot test was to enhance exposure of the LNAPL smear zone within the Main Sand stratum situated between 385 and 400 ft-amsl (approximately 30 to 45 ft-bgs). The pilot test was designed to evaluate the extent to which focused pumping could: (1) sustain unconfined conditions, (2) expose additional portions of the smear zone, and (3) allow recovery of mobile LNAPL present in the Main Sand stratum beneath Area A.
Initially, focused pumping began on March 8, 2014 but was discontinued prior to completion of the pilot test on April 2, 2014, due to several significant rainfall events (4-inches of precipitation over the previous three days) which resulted in a rebound of the water table above the focused pumping pilot test triggers. Focused pumping was resumed on January 9, 2015 and continued through March 10, 2015, once groundwater elevation triggers were reached again. The groundwater elevation triggers were established to ensure that focused pumping was conducted during seasonally low groundwater conditions. Prior to each of the focused pumping events, infrastructure for groundwater extraction and treatment, as well as LNAPL recovery and storage were installed within Area A.
During the 2014 and 2015 pilot tests, groundwater was extracted at rates exceeding 300 gpm and resulted in exposure of between 25 and 40% of the LNAPL smear zone beneath Area A. Even under these extremely low groundwater conditions, LNAPL was not recovered. During the pilot tests, LNAPL thicknesses were not measured above 0.1-feet within any of the monitoring locations installed within 75 feet of the groundwater production well. While LNAPL was initially present at a greater thickness within several of the monitoring locations situated between 75 and 250 feet of the production well, the thickness decreased over the duration of the pilot test such that LNAPL was only present in a single location (monitoring point MP-055C at 0.02-feet) on the final day of the pilot test when the water table was measured at the lowest elevation (Trihydro 2015c). The results of the focused pumping pilot tests demonstrated that the second part of the DOLR model was not valid and that vertical drainage of LNAPL under highly unconfined conditions did not result in enhanced LNAPL recovery. This was attributed to low saturations measured in the soil cores and low LNAPL transmissivity estimates determined via baildown testing within Area A (Trihydro 2015c).
4.3.3.3. LNAPL SKIMMING UNDER CONFINED AND UNCONFINED CONDITIONS
LNAPL skimming at the Hartford Site has been conducted under highly confined, confined, and unconfined conditions. The figures provided in Appendix E depict fluid level elevations and LNAPL recovery rates since 2005 within selected recovery wells, groundwater monitoring wells, and multipurpose monitoring points where pilot testing of MPE (via mobile high-vacuum recovery) was performed in 2005 (H2A 2006) and subsequently underwent routine manual LNAPL skimming between 2010 and 2012. During manual skimming, field personnel would visit a location with more than 0.5-feet of LNAPL, conduct skimming, and then allow the LNAPL to recharge before skimming again. This method would mean that drawdown in the monitoring location would be maximized immediately following skimming and would then decrease over time until the next skimming event.
The LNAPL recovery rates depicted on the figures in Appendix E are the monthly volume recovered via manual skimming (i.e., units are gallons per month). These figures also display the elevation of the confining stratum based on the lithology recorded during installation of these wells and monitoring points. Confined conditions are inferred where the groundwater elevation was above the bottom of the overlying clay. Finally, the hydrographs display the vertical interval of the LNAPL smear zone based on nearby historical LIF borings. Note that the lithology and LIF data presented on the figures included within Appendix E are a subset of the data used to develop the 3D model described in Section 4.1.
These hydrographs indicate that the majority of manual LNAPL skimming was conducted under confined conditions compared to unconfined conditions since 2005, as confined conditions occurred more frequently and lead to exaggerated LNAPL thicknesses targeted for skimming by the field personnel. The LNAPL recovery rates for skimming under confined conditions show significant variability at a given location that may be related to competing LNAPL recoverability characteristics as described by the DOLR model. The confining pressures may have resulted in the groundwater monitoring well or monitoring point acting as a pressure relief point; however, elevated water saturations meant that only a minimal mass of mobile LNAPL was available within the radius of capture of the monitoring location. When skimming was conducted under unconfined conditions, smaller volumes of LNAPL were recovered. Inspection of the hydrographs provided in Appendix E, shows that between 2005 and 2012 when skimming was performed, unconfined conditions were limited to the upper portions of the smear zone in the Main Sand stratum.
An estimate of the radius of capture for manual LNAPL skimming conducted in the groundwater monitoring wells or multipurpose monitoring points has not been performed via volumetric analyses, LNAPL tracer testing, or some other method. Charbeneau and Beckett (2007) suggest a radius of capture for LNAPL skimming between 10 and 30 feet. It is expected that the radius of capture for manual skimming would be on the low end of the suggested radius of capture as a result of the methodology used to recover LNAPL. As previously described, drawdown would be maximized immediately after skimming, and would decrease over time until the next skimming event. Since drawdown was lower during recharge, this probably meant a lower radius of capture than would have been achieved with a dedicated skimmer, as assumed by Charbeneau and Beckett (2007). As shown on the figures provided in Appendix D and Appendix E, LNAPL thicknesses have remained relatively unchanged within those locations screened in the Main Sand stratum where skimming was conducted. As described in Section 4.2.5, decreasing LNAPL thickness trends were limited to a few locations situated in Effectiveness Zone 5.
4.4. LNAPL CSM SUMMARY
LNAPL beneath the Hartford Site is predominantly comprised of a weathered gasoline with a weathered diesel observed predominantly in the Rand and EPA stratum. A mixture of weathered gasoline and diesel is observed in the Main Sand Stratum beneath Effectiveness Zones 1 and 6. LNAPL samples collected beneath the Hartford Site generally have viscosities below 1 cp, consistent with gasoline and diesel mixtures. There has been some depletion of the individual constituents that make up the LNAPL source, based on reduction in the benzene effective solubility estimates for LNAPL samples collected in 2006, 2009, and 2015.
Vertical smearing of the LNAPL has occurred over time as a result of significant fluctuation of the groundwater within the hydrostratigraphic units, leaving some LNAPL within the soil pore spaces below and above the water table. The nature and extent of the LNAPL smear zone has been previously defined across the various hydrostratigraphic units using LIF, soil coring, and routine fluid level monitoring. The bottom of the "smear zone" is roughly coincident with the historical low groundwater elevation in the Main Sand stratum (10 to 20 feet lower than typical groundwater elevations observed over the past decade). The thickness of the smear zone is variable measuring only a few inches at the edges of the smear zone, up to tens of feet in locations near historical releases and along the boundaries of the clay strata. While LNAPL is present within each of the hydrostratigraphic units, the majority of the remaining mass is present within the Main Sand stratum.
There is evidence of depletion of the LNAPL smear zone based on a comparison of the historical and recent LIF measurements in co-located borings, as well as examination of the LNAPL thickness trends. These changes are predominantly observed in the shallow strata (North Olive, Rand, and Main Silt) and along the southern and western margins of the LNAPL smear zone.
Approximately 3.2 million gallons of LNAPL has been recovered beneath the Hartford Site via interim measures between 1978 and 2017. LNAPL recoverability is a function of water table elevation which has changed significantly beneath the Hartford Site. The DOLR model (H2A 2006) developed for the Hartford Site explains the occurrence and potential recoverability of LNAPL under various hydraulic conditions. In summary, the DOLR model suggests that LNAPL thicknesses in wells will be high under confining conditions, with initial high LNAPL recovery rates that may decrease over time because the mass of mobile LNAPL is minimal and much of the LNAPL is submerged (although optimization of recovery under confining conditions is possible under certain lithologic conditions). Under unconfined conditions, LNAPL thicknesses may be smaller, and recovery rates may be relatively low because the wells are no longer acting as “pressure relief” points and much of the LNAPL continues to be submerged. Under highly unconfined conditions, relatively high LNAPL recovery rates may be attained because the largest vertical interval of LNAPL is unsubmerged.
LNAPL recovery performed under highly confined, confined, and unconfined conditions over the last decade at the Hartford Site have generally supported predictions of the DOLR model, with a rapid decrease in the rate of recovery and LNAPL transmissivity observed within the wells where skimming had been conducted and LNAPL thicknesses rebounding quickly across much of the Hartford Site following termination of skimming activities in 2012. However, pilot testing under highly unconfined conditions via focused pumping resulted in no additional LNAPL recovery beneath Area A; refuting the premise within the DOLR that LNAPL recovery would be enhanced under highly unconfined conditions. The lack of LNAPL recovery during the focused pumping pilot tests conducted under highly unconfined conditions was attributed to low LNAPL saturation and LNAPL transmissivities in this portion of the Main Sand stratum. If low LNAPL saturations and transmissivities are identified within the hydrostratigraphic units beneath the proposed remediation management areas (defined via consideration of the data included in the LNAPL component of the CSM), then additional engineering alternatives (beyond hydraulic recovery methods) will be evaluated and tested if additional corrective measures are required to meet the remaining remediation objectives, remedial goals, and end-points.