
Download Full
Document Here
Conceptual Site Model, March 2018
Hartford Petroleum Release Site
2. SITE SETTING
The Village of Hartford is located in the Springfield Plain of the Interior Plains Section of the Central Lowland Province, within a shallow valley approximately 30 miles long and 11 miles across at its widest point. The Hartford Site is underlain by more than 100 feet of unconsolidated deposits created by alluvial and glacial processes during the Pleistocene Epoch.
The Hartford Site is located along the historical edges of the Mississippi and Missouri River flood plains. Over the last 125,000 years, the Mississippi River has changed its course frequently through a process known as avulsion. An avulsion occurs when a river breaches its natural levee and then cuts a new channel in the adjacent floodplain. These frequent avulsions of the river have resulted in deposition of sediments with widely-varying grain size (including thick sequences of channel sands, lenticular splay sands, fine-grained levee sands, and finer-grained silty-clay floodplain deposits) across a broad area creating a highly heterogeneous unconsolidated stratigraphy (USEPA et al. 2010). These deposits are collectively referred to as the Cahokia Alluvium of Holocene Age. Underlying these alluvial deposits are a relatively thick sequence of sandy glacial outwash (between 60 and 150 feet thick) deposited during the Pleistocene Epoch, as the broad shallow valley was filled as part of a large outwash plain as the continental glaciers retreated. These sands are generally referred to as the Mackinaw Member of the Henry Formation and locally have been referred to as the Main Sand hydrostratigraphic unit.
These fluvial and glacial sediments are underlain by the Glasford Till or consolidated sedimentary bedrock more than 3,800 feet thick. These bedrock formations dip gently to the northeast from the Ozark Highlands toward the Illinois Basin and predominantly consist of limestone and dolomite with lesser amounts of sandstone and shale. Mississippian age bedrock believed to be the Renault Limestone underlies the Hartford Site. The Renault Limestone consists of relatively pure limestone and an upper sandy limestone (Clayton 2005). The limestone generally occurs more than 100 feet below ground surface (ft-bgs).
2.1. GENERALIZED STRATIGRAPHIC INTERPRETATION
A three-dimensional (3D) visualization of the generalized stratigraphic interpretation was prepared as part of the revised LNAPL Component to the Conceptual Site Model, Hartford Petroleum Release Site Hartford, Illinois (LNAPL Component to the CSM, Trihydro 2014b). This 3D visualization incorporated the stratigraphic interpretations from 379 soil borings (later completed as groundwater, vapor, and multipurpose monitoring locations) summarized within the LNAPL Active Recovery System Conceptual Site Model, The Hartford Area Hydrocarbon Plume Site (LNAPL Active Recovery System CSM, Clayton 2005) and maintained within an Earthsoft EQuIS™ SQL database by the Hartford Working Group. The stratigraphic interpretation was verified using detailed lithologic descriptions recorded via Cone Penetration Testing (CPT) performed within more than 100 borings. A map showing the locations of the groundwater monitoring wells, nested vapor monitoring wells, vapor monitoring points, multipurpose monitoring locations, as well as the soil boring locations where laser induced fluorescence (LIF) and CPT was performed is included in Appendix A.
Leapfrog Hydro™, a specialized visualization software, was used to integrate the generalized stratigraphic interpretations into a 3D mesh, with zones between data points using all adjacent borings for interpolation. The stratigraphic units (e.g., A-Clay, North Olive stratum, etc.) were modeled as geologic layers, configured with horizontal reference planes. Within Leapfrog Hydro™, the contact surfaces were ordered to achieve the following layering of output volumes/strata (from shallowest to deepest) as historically described by the Hartford Working Group within the LNAPL Active Recovery System CSM (Clayton 2005)1:
- A-Clay
- North Olive
- B-Clay
- Rand
- C-Clay
- EPA
- D-Clay, and
- Main Sand
Example cross sections depicting both the generalized stratigraphic interpretation of the geology beneath the Hartford Site are provided on Figure 2-1 (section along North Olive Avenue) and Figure 2-2 (section along North Market Street). In addition, an example 3D isopach map of the generalized stratigraphy showing the clay, silt, and sand units (between North Olive Avenue and North Market Street) is included on Figure 2-3. The following subsections describe the generalized stratigraphic units previously defined by the Hartford Working Group. Isopach maps and detailed descriptions of the shallow geology have previously been presented in the LNAPL Active Recovery System CSM (Clayton 2005).
2.1.1. A-CLAY
The A-Clay is the shallowest unit and ranges in thickness from 5 to 24 feet. The A-Clay is continuously present beneath the Hartford Site, except in areas where it has been removed as part of construction activities. As described in the LNAPL Active Recovery System CSM (Clayton 2005), the A- Clay is generally thickest: (1) near the intersection of West Date Street and North Delmar Avenue, and (2) north of West Rand Avenue along Illinois State Route 3. The A-Clay is thinnest (generally less than 10 feet thick): (1) near the intersection of West Date Street and North Old St. Louis Road, (2) between West Watkins and West Forest Streets, (3) between East Rand Avenue and East Forest Street along North Olive Avenue, and (4) along East Forest Street between North Delmar Avenue and North Olive Avenue.
Previously collected geotechnical samples (Clayton 2005) collected from the clay units (including the A-Clay) contain mixtures of silt and clay ranging between 85% clay-15% silt and 20% clay-80% silt. Minor amounts of sand, generally less than 15% were occasionally observed within the clay units.
2.1.2. NORTH OLIVE STRATUM
The North Olive stratum is encountered at depths ranging from approximately 8 to 15 ft-bgs and extends across the northern portions of the Hartford Site, with the most notable absence along North Delmar Avenue and North Market Street, as shown on Figure 2-4. The North Olive stratum is bounded by the A- and B-Clay and is comprised of approximately 10% sand, 70% silt, and 20% clay based on previously collected geotechnical samples (Clayton 2005). The North Olive stratum ranges from less than 1-foot to 10-feet thick and is generally thickest (1) along North Olive Avenue between East Date and East Watkins Streets, (2) between Rand Avenue and Arbor Street, (3) at the intersection of North Delmar Avenue and West Birch Street, and (4) in the vicinity of the Hartford Community Center.
2.1.3. B-CLAY
The B-Clay, underlies and defines the extent of the North Olive stratum, where present, and overlies the Rand stratum. The B-Clay is highly discontinuous and is generally absent beneath the central and southern portions of the Hartford Site. The B-Clay ranges in thickness from less than 1 foot to 12 feet and is generally thickest (1) near the intersection of East Elm Street and North Olive Avenue, (2) between East Date and East Cherry Streets, (3) near the intersection of East Birch and North Market Streets, (4) between West Cherry and West Date Streets, and (5) near the intersection of East Rand Avenue and North Olive Avenue (Clayton 2005).
2.1.4. RAND STRATUM
The Rand stratum is discontinuous and generally encountered at depths ranging from 12 to 27 ft- bgs and is defined by the extent of the C-Clay. Based on previously collected geotechnical samples, the Rand stratum is composed of approximately 10% sand, 70% silt, and 20% clay and is similar in composition to the North Olive stratum, and also that of the Main Silt in some areas (Clayton 2005). This stratum appears to extend across the majority of the northern and eastern portions of the Hartford Site as shown on Figure 2-5. The Rand stratum grades laterally into the Main Silt and Main Sand and is locally absent north and south of West Rand Avenue between North Delmar Avenue and North Old St. Louis Road. Where the Rand Stratum is absent, the B- and C-Clays are undifferentiated. The Rand stratum ranges in thickness from less than 1 foot to 16 feet and is thickest (1) between East Rand Avenue and East Birch Street, and (2) between East Date and East Forest Streets. The Rand stratum tends to be thinnest along the western portions of the Hartford Site.
2.1.5. C-CLAY
The C-Clay defines the extent of the Rand stratum and ranges in thickness from less than 1 foot to approximately 8 feet. The C-Clay is highly discontinuous and only present in the northern and eastern portion of the Hartford Site. The edge of this clay unit trends to the southeast from approximately the intersection of West Cherry Street and North Old St. Louis Road to the intersection of East Watkins Street and North Olive Avenue. The C-Clay is thickest in the area (1) near the intersection of East Cherry Street and North Olive Avenue, (2) near the intersection of East Date and North Market Streets, (3) between East Elm and East Forest Streets west of North Olive Avenue, and (4) between West Birch and West Cherry Streets.
2.1.6. EPA STRATUM
As shown on Figure 2-6, the EPA stratum is only present in the northeastern portion of the Hartford Site at depths ranging from 27 to 46 ft-bgs. Based on prior geotechnical analyses, the EPA is composed of approximately 70% sand, 20% silt, and 10% clay (Clayton 2005). This stratum is differentiated from the Main Sand by the D-Clay. The EPA grades laterally into the Main Sand south of a southeasterly trending line starting at the intersection of North Old St. Louis Road and North Delmar Avenue to the intersection of East Date Street and North Olive Avenue. Along this boundary, the EPA and Main Sand are hydraulically connected. The EPA stratum ranges from approximately 4 to 9 feet thick within the northeastern portion of the Hartford Site and is thickest north of West Rand Avenue (Clayton 2005).
2.1.7. D-CLAY
The D-Clay underlies the EPA stratum and is typically encountered at depths ranging from 32 and 47 ft-bgs, with a thickness from approximately 2 to 7 feet thick. This fine-grained unit could be considered a discontinuous lens within the Main Sand, based on its relative thickness and limited extent. The D-Clay is thickest near the intersection of North Delmar Avenue and North Old St. Louis Road and thins out along its western margin (Clayton 2005).
2.1.8. MAIN SILT STRATUM
The Main Silt is encountered at depths ranging from approximately 6 to 30 ft-bgs, where the B- and/or C-Clay are absent. The Main Silt begins along the same southeasterly trending line as the C- Clay, as shown on Figure 2-7. Previous descriptions (Clayton 2005, Clayton 2006) of the extent of the Main Silt have been inconsistent due in part to the challenges in differentiating the stratum from the Rand and Main Sand strata. The Main Silt has been described as compositionally similar to the North Olive and Rand strata (approximately 25% sand, 65% silt, and 10% clay), and although compositionally different from the Main Sand, the gradational contact between the Main Silt and Main Sand makes discerning the strata difficult (Clayton 2005).
The interpretation of the lateral extent of the Main Silt, shown on Figure 2-7, is based on a review of historical isopach maps, geologic cross-sections, and lithologic logs from borings installed throughout the Hartford Site. In general, the top surface of the Main Silt is equivalent to the same horizon as the top of the North Olive stratum. The majority of the bottom surface of the Main Silt is equivalent to the same horizon as the top of the EPA stratum. The Main Silt ranges in thickness from approximately 2 to 17 feet and is thickest along the contact with the Rand stratum. The Main Silt is thinnest in areas where the A-Clay is thickest, such as between West Forest and West Watkins Streets along North Delmar Avenue.
2.1.9. MAIN SAND STRATUM
The Main Sand is extensive throughout the region. In Hartford, it is encountered at depths ranging from 19 to 45 ft-bgs based on the presence or absence of the overlying clay units. Although the Main Sand is primarily comprised of 90% sand, 5% silt, and 5% clay, discontinuous silty-clay and clayey-silt lenses of limited thickness and extent occur at various depths within the Main Sand (Clayton 2005). Gravels are also observed in lenses within the Main Sand stratum. The thickness of the Main Sand stratum ranges from 80 to 100 feet, with bedrock generally encountered at an elevation between 300 and 325 feet above mean sea level (ft-amsl).
2.2. DETAILED LITHOLOGIC INTERPRETATION
As shown on Figures 2-1 through 2-3, a more detailed 3D visualization of the lithology was created for a portion of Soil Vapor Extraction (SVE) Effectiveness Zone 6. The six effectiveness monitoring zones are depicted on the map included in Appendix A. Lithologic data (i.e., data specifying the start and end depth of a particular soil type) from 48 unique borings installed in northern portions of SVE Effectiveness Zone 6 were used to develop the detailed 3D visualization. The lithology described by the geologist was assigned a United Soil Classification System (USCS) soil type, which was recorded on the log generated for each soil boring. The USCS soil types were converted to a numerical value based on grain size and sorting as follows:
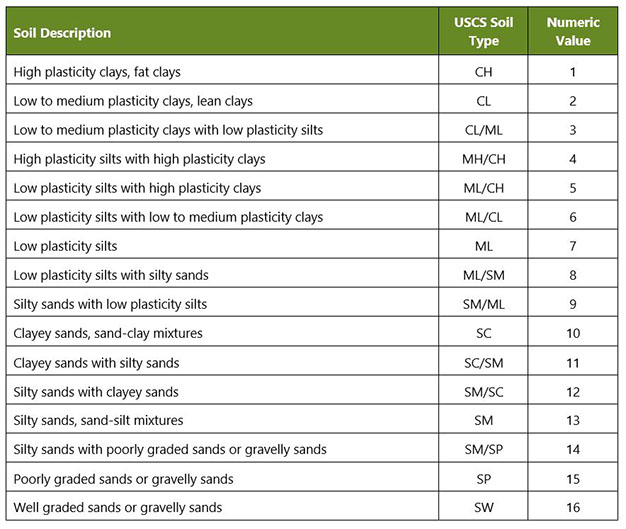
It should be noted that there are many additional USCS soil types and combined soil types than those listed on preceding table. Only those USCS symbols and combined symbol types identified on the lithologic logs for the 48 borings installed in northern portions of SVE Effectiveness Zone 6 were used to create the 3D visualization.
The numerical values assigned for each vertical lithologic interval were then incorporated into Leapfrog Hydro™ and modeled using a linear interpolant to create an implicit model of the detailed lithology. Interpolation is a method that produces an estimate or “interpolated value” between known data points. The interpolant is used to assign a weighting to the known data based on the distance away from the unknown value, or in this case the lithology. Samples that are assigned lower weighting by the interpolant have a stronger effect on the estimated value than those that are given higher weighting. The linear interpolant assumes that data closer to the unknown value are more important than data that is further away (Leapfrog 2013). Similar to an inverse distance weighting algorithm, Leapfrog Hydro™ uses a radial basis function for interpolation, with the interpolation being symmetrical for a sphere around a given data point and a “spline function” for smoothing between data points. The primary non-default user input for this software algorithm is the horizontal to vertical anisotropy (H:V), which was set to 100:1. The 100:1 H:V anisotropy was selected based on visual comparison of previously generated cross sections to the 3D visualization. A detailed summary of the Leapfrog Hydro™ implicit model inputs and assumptions were provided in the final Soil Vapor Extraction System Effectiveness Zone 6 Optimization Report, Hartford Petroleum Release Site (SVE Effectiveness Zone 6 Optimization Report, 212 Environmental 2016c).
The lateral limits of the 3D model were clipped to an area extending beyond the lateral extent of the borings in the four cardinal directions. Specifically, the model extended from East Cherry Street to approximately 140 feet south of East Rand Street, and approximately 40 feet west of North Market Avenue to approximately 5 feet east of the intersection of North Olive Avenue and East Cherry Street.
Cross sections depicting the more detailed lithologic interpretation were compared to the generalized stratigraphic interpretation on Figure 2-1 (section along North Olive Avenue) and Figure 2-2 (section along North Market Street). In addition, 3D isopachs showing the major soil types (clays, silts, and sands) beneath SVE Effectiveness Zone 6, as depicted in the detailed lithologic interpretation are included on Figure 2-3. The detailed lithologic interpretation illustrates the highly heterogeneous and interbedded nature of the reworked alluvial and glacial sediments in the upper 40 feet of the subsurface beneath the Hartford Site. In particular, this interpretation illustrates the discontinuous nature of clay lenses deeper than 10 ft-bgs. The clays are shown as continuous units (identified as the B-, C-, and D-Clay) within the generalized stratigraphic interpretation but are more definitively represented as isolated lenses within the detailed lithologic interpretation. Furthermore, the detailed lithologic interpretation depicts a coarsening sequence from the continuous clay layer present in the shallowest portions of the subsurface (referred to as the A-Clay) down to the regionally extensive sand deposits at depth (referred to as the Main Sand stratum) that cannot be inferred from the general stratigraphic interpretation of the geology.
The detailed lithologic interpretation was compared to the CPT results from seven borings (HROST- 006, -010, -012, -015, -076, -125, and -130) installed in SVE Effectiveness Zone 6, as depicted on Figures 2-1 and 2-2. While the detailed lithologic interpretation depicts a more nuanced and discontinuous setting within the upper 40 feet of the subsurface compared to the generalized stratigraphic interpretation, it is not any more accurate in showing the actual geology, as reported within the borings installed via CPT. For this update to the CSM, the generalized stratigraphic interpretation will be used to describe groundwater occurrence and distribution of petroleum related constituents. The generalized stratigraphic interpretation represents a common and historically utilized framework for describing the conditions beneath the Hartford Site. However, it may be necessary to complete additional 3D visualizations of the detailed lithologic setting, similar to the modeling performed in SVE Effectiveness Zone 6, as part of designing future corrective measures within specific remedial management areas.
2.3. HYDROGEOLOGIC SETTING
Groundwater is present within the extensive deposits of unconsolidated glacial fill of the Mackinaw Member of the Henry Formation, locally referred to as the Main Sand stratum. Groundwater within the glacial fill is considered the most significant aquifer in the region, extending across an area of approximately 175 square miles. This aquifer, present in the Main Sand stratum, is commonly referred to as the American Bottoms aquifer. Natural groundwater movement within the American Bottoms aquifer is to the west, draining water from the limestone bluffs (along the east wall of the floodplain valley) into the Mississippi River (Engineering-Science 1992).
There are two additional water bearing, or hydrostratigraphic units, located within the Cahokia Alluvium, and a third hydrostratigraphic unit that has been differentiated in the upper portions of the glacial fill of the Mackinaw Member of the Henry Formation beneath the Hartford Site. The shallow hydro-stratigraphic units are generally present within the highly discontinuous silt and fine sand deposits identified as the North Olive and Rand strata. The deeper EPA stratum is compositionally similar to the Main Sand and is only separated from the Main Sand by the D-Clay. As stated in Section 2.1.7, the D-Clay could be considered a discontinuous lens within the Main Sand stratum based on its relative thickness (between approximately 2 to 7 feet) and limited extent beneath the Hartford Site.
The Mississippi River is located less than a half mile west of the Hartford Site and is hydraulically connected to groundwater within the Rand and EPA (where present), as well as the Main Sand. Water level fluctuations in each unit are affected by changes in the Mississippi River stage. Since the river stage varies by more than 20 feet during a year, the groundwater conditions can fluctuate from unconfined to confined conditions. It should be noted that the United States Army Corps of Engineers controls the Mississippi River stage as part of flood prevention efforts up- and down- stream of the Village of Hartford. As such, river stage can fluctuate due to ambient, or natural, conditions (e.g., spring thaw of snow pack, localized precipitation events, drought conditions) but can also be artificially manipulated irrespective of ambient conditions.
2.3.1. NORTH OLIVE STRATUM
Groundwater within the North Olive stratum occurs as isolated areas of temporarily perched water on the surface of the underlying B-Clay. Flow along the clay surface is highly variable, and it is not possible to generate potentiometric surface maps representing flow within this stratum. Hydraulic conductivity estimates based on a limited number of slug tests performed by the Hartford Working Group in the North Olive stratum ranged from 2.9E-04 to 1.4E-06 centimeters per second (cm/s). These hydraulic conductivity estimates within the North Olive stratum were similar to the hydraulic conductivities measured in the overlying A-Clay and underlying B-Clay, which ranged from 1.7E-04 to 6.0E-09 cm/s (Clayton 2005). Recharge within the North Olive stratum is predominantly via precipitation.
2.3.2. RAND STRATUM
Groundwater in the Rand stratum occurs as localized areas of perched water on the surface of the underlying C-Clay. Hydraulic conductivity measured in the Rand stratum ranges from 7.9E-03 to 5.5E-05 cm/s (Clayton 2005). Groundwater within the Rand stratum is unconfined during periods of low Mississippi River stage and becomes confined during times of high river stage. Recharge within the Rand stratum occurs via precipitation and local downward migration from the overlying North Olive stratum through the discontinuous and leaky B-Clay. Additionally, recharge of groundwater into the Rand stratum occurs due to upward vertical migration of groundwater from the deeper hydrostratigraphic units through the discontinuous and leaky C-Clay, as well as at the contact with the Main Silt stratum.
2.3.3. EPA STRATUM
Groundwater flow within the EPA stratum (beneath the northeastern portion of the Hartford Site) is generally to the southwest. As groundwater within the EPA stratum flows beyond the extent of the D-Clay, it is hydraulically connected to the Main Sand and flows to the west and northwest. In the northeastern portion of Hartford, the hydraulic conductivity in the EPA stratum has been measured between 3.8E-04 and 1.5E-05 cm/s (Clayton 2005).
2.3.4. MAIN SAND STRATUM
Groundwater in the Main Sand aquifer within the Village of Hartford is generally unconfined during periods of drought and low Mississippi River stage, which generally occurs for no more than several months each year, typically in the winter (January through March). Groundwater becomes confined by the overlying C- and D-Clay (where present), and in some places by the Main Silt, during times of normal and high river stage. There are some areas within the Main Sand where confined conditions may persist throughout the entire year, such as the northeast portion of the Hartford Site near the intersection of North Olive Avenue and East Rand Avenue where the D-Clay is present.
Groundwater elevations within the Main Sand have fluctuated significantly over the past 50 years. Historical fluid level monitoring data indicate that groundwater elevations reached a high of approximately 415 ft-amsl during the early-1990s and have been as low as approximately 380 ft-amsl in the mid-1950s, which is typically 10 to 15 feet lower than conditions that have prevailed since 2004. The low groundwater elevations observed during the mid-1950s (that have not been observed since then) may be attributed to (1) the lowest mean Mississippi River stage as a result of extreme drought conditions, and (2) a period of maximum pumping of groundwater from the facilities adjacent to the Hartford Site (USEPA et al. 2010). The United States Army Corp of Engineers constructed Dam No. 27 (a.k.a. the Chain of Rocks Dam), between 1959 and 1963, down-stream of the Hartford Site. This low water dam raised the minimum river stage to 9 feet within the Mississippi River from Dam No. 27 up-stream to the Melvin Price Dam (which replaced Dam No. 26), which also may explain why groundwater elevations in the Main Sand have not reached the historical lows observed in the 1950s.
There is a significant difference between the hydraulic conductivity measured in the Main Sand aquifer and those of the overlying hydrostratigraphic units. The hydraulic conductivity for the Main Sand in the central portion of the Hartford Site determined via slug testing performed under unconfined conditions in wells screened across the upper portion of the hydrostratigraphic unit ranged from 1.6E-02 to 3.1E-02 cm/s. Hydraulic conductivity was estimated as 3.8E-02 cm/s during an extended pumping test performed in 2014 using a production well screened in the deeper portions of the Main Sand stratum (Trihydro 2014b). Hydraulic conductivities reported via pump tests in the production wells installed into the deeper portions of the Main Sand stratum on the Premcor facility have been reported as high as 1.0E-01 cm/s (Clayton 2005). In general, groundwater production wells have been screened within deeper portions of the Main Sand stratum (between 330 and 360 ft-amsl) because of the elevated hydraulic conductivity, water level fluctuations, and saturated thickness (between 80 and 100 feet), resulting in high groundwater transmissivities within the aquifer.
The natural groundwater flow regime in the Main Sand stratum has been altered beneath the Hartford Site due to pumping on the British Petroleum (approximately 1,225 gallons per minute (gpm)), Phillips66 (more than 6,000 gpm along the river dock and 3,000 gpm on the refinery), and Premcor (approximately 300 gpm) facilities. During periods of high river stage, which are defined by periods when the river stage exceeds 410 ft-amsl (greater than the 75th percentile of all river stage measurements collected since 2004), groundwater flow is generally towards the east to northeast due to recharge from the river and bank storage within the Main Sand. During moderate river elevations, the groundwater flow direction is northward. During low river stages, which are defined by periods when the river elevation is less than 400 ft-amsl (less than the 25th percentile of all river stage measurements collected since 2004), groundwater flow trends northwesterly to westerly. Groundwater flow in the Main Sand stratum beneath the Hartford Site has been in a northerly direction attributed to large scale pumping by these facilities since at least 1951 (Mathes 1979).
However, in the absence of groundwater production by the various facilities around the Hartford Site, groundwater flow within the Main Sand under typical river stage conditions may have been to the west, towards the Mississippi River. As shown on Figure 1-1, groundwater within the deep portions of the Main Sand stratum are utilized as a drinking water resource by the Village of Hartford, more than 1,700 feet (well beyond the 1,000-foot maximum setback zone) to the southwest of the currently known extent of petroleum hydrocarbons attributed to releases from the refineries and terminals. The two operational groundwater production wells (WSW-3 and WSW-4) operated by the Village of Hartford have a total depth of approximately 105 ft-bgs and were constructed with between 20 and 35 feet of screen. Discontinuous pumping from these wells (average of 150 gpm) is at a much lower rate than that performed on the various facilities located to the north of the well field and does not affect flow direction within the Main Sand aquifer beneath the Hartford Site.